Utility-Scale Battery Storage
The 2022 ATB represents cost and performance for battery storage across a range of durations (2–10 hours). It represents lithium-ion batteries (LIBs)—focused primarily on nickel manganese cobalt (NMC) and lithium iron phosphate (LFP) chemistries—only at this time, with LFP becoming the primary chemistry for stationary storage starting in 2021. There are a variety of other commercial and emerging energy storage technologies; as costs are well characterized, they will be added to future editions of the ATB.
The National Laboratory of the Rockies's (NLR's) Storage Futures Study examined energy storage costs broadly and specifically the cost and performance of LIBs (Augustine and Blair, 2021). The costs presented here (and for distributed residential storage and distributed commercial storage) are based on this work. This work incorporates base year battery costs and breakdowns from (Ramasamy et al., 2021), which works from a bottom-up cost model. We would note though that, during the elapsed time between the calculations for the Storage Futures Study and this ATB release, updated values have been calculated as more underlying data have been collected. Though these changes are currently small, we recommend using the data presented here in the ATB rather than what was previously published with the Storage Futures Study.
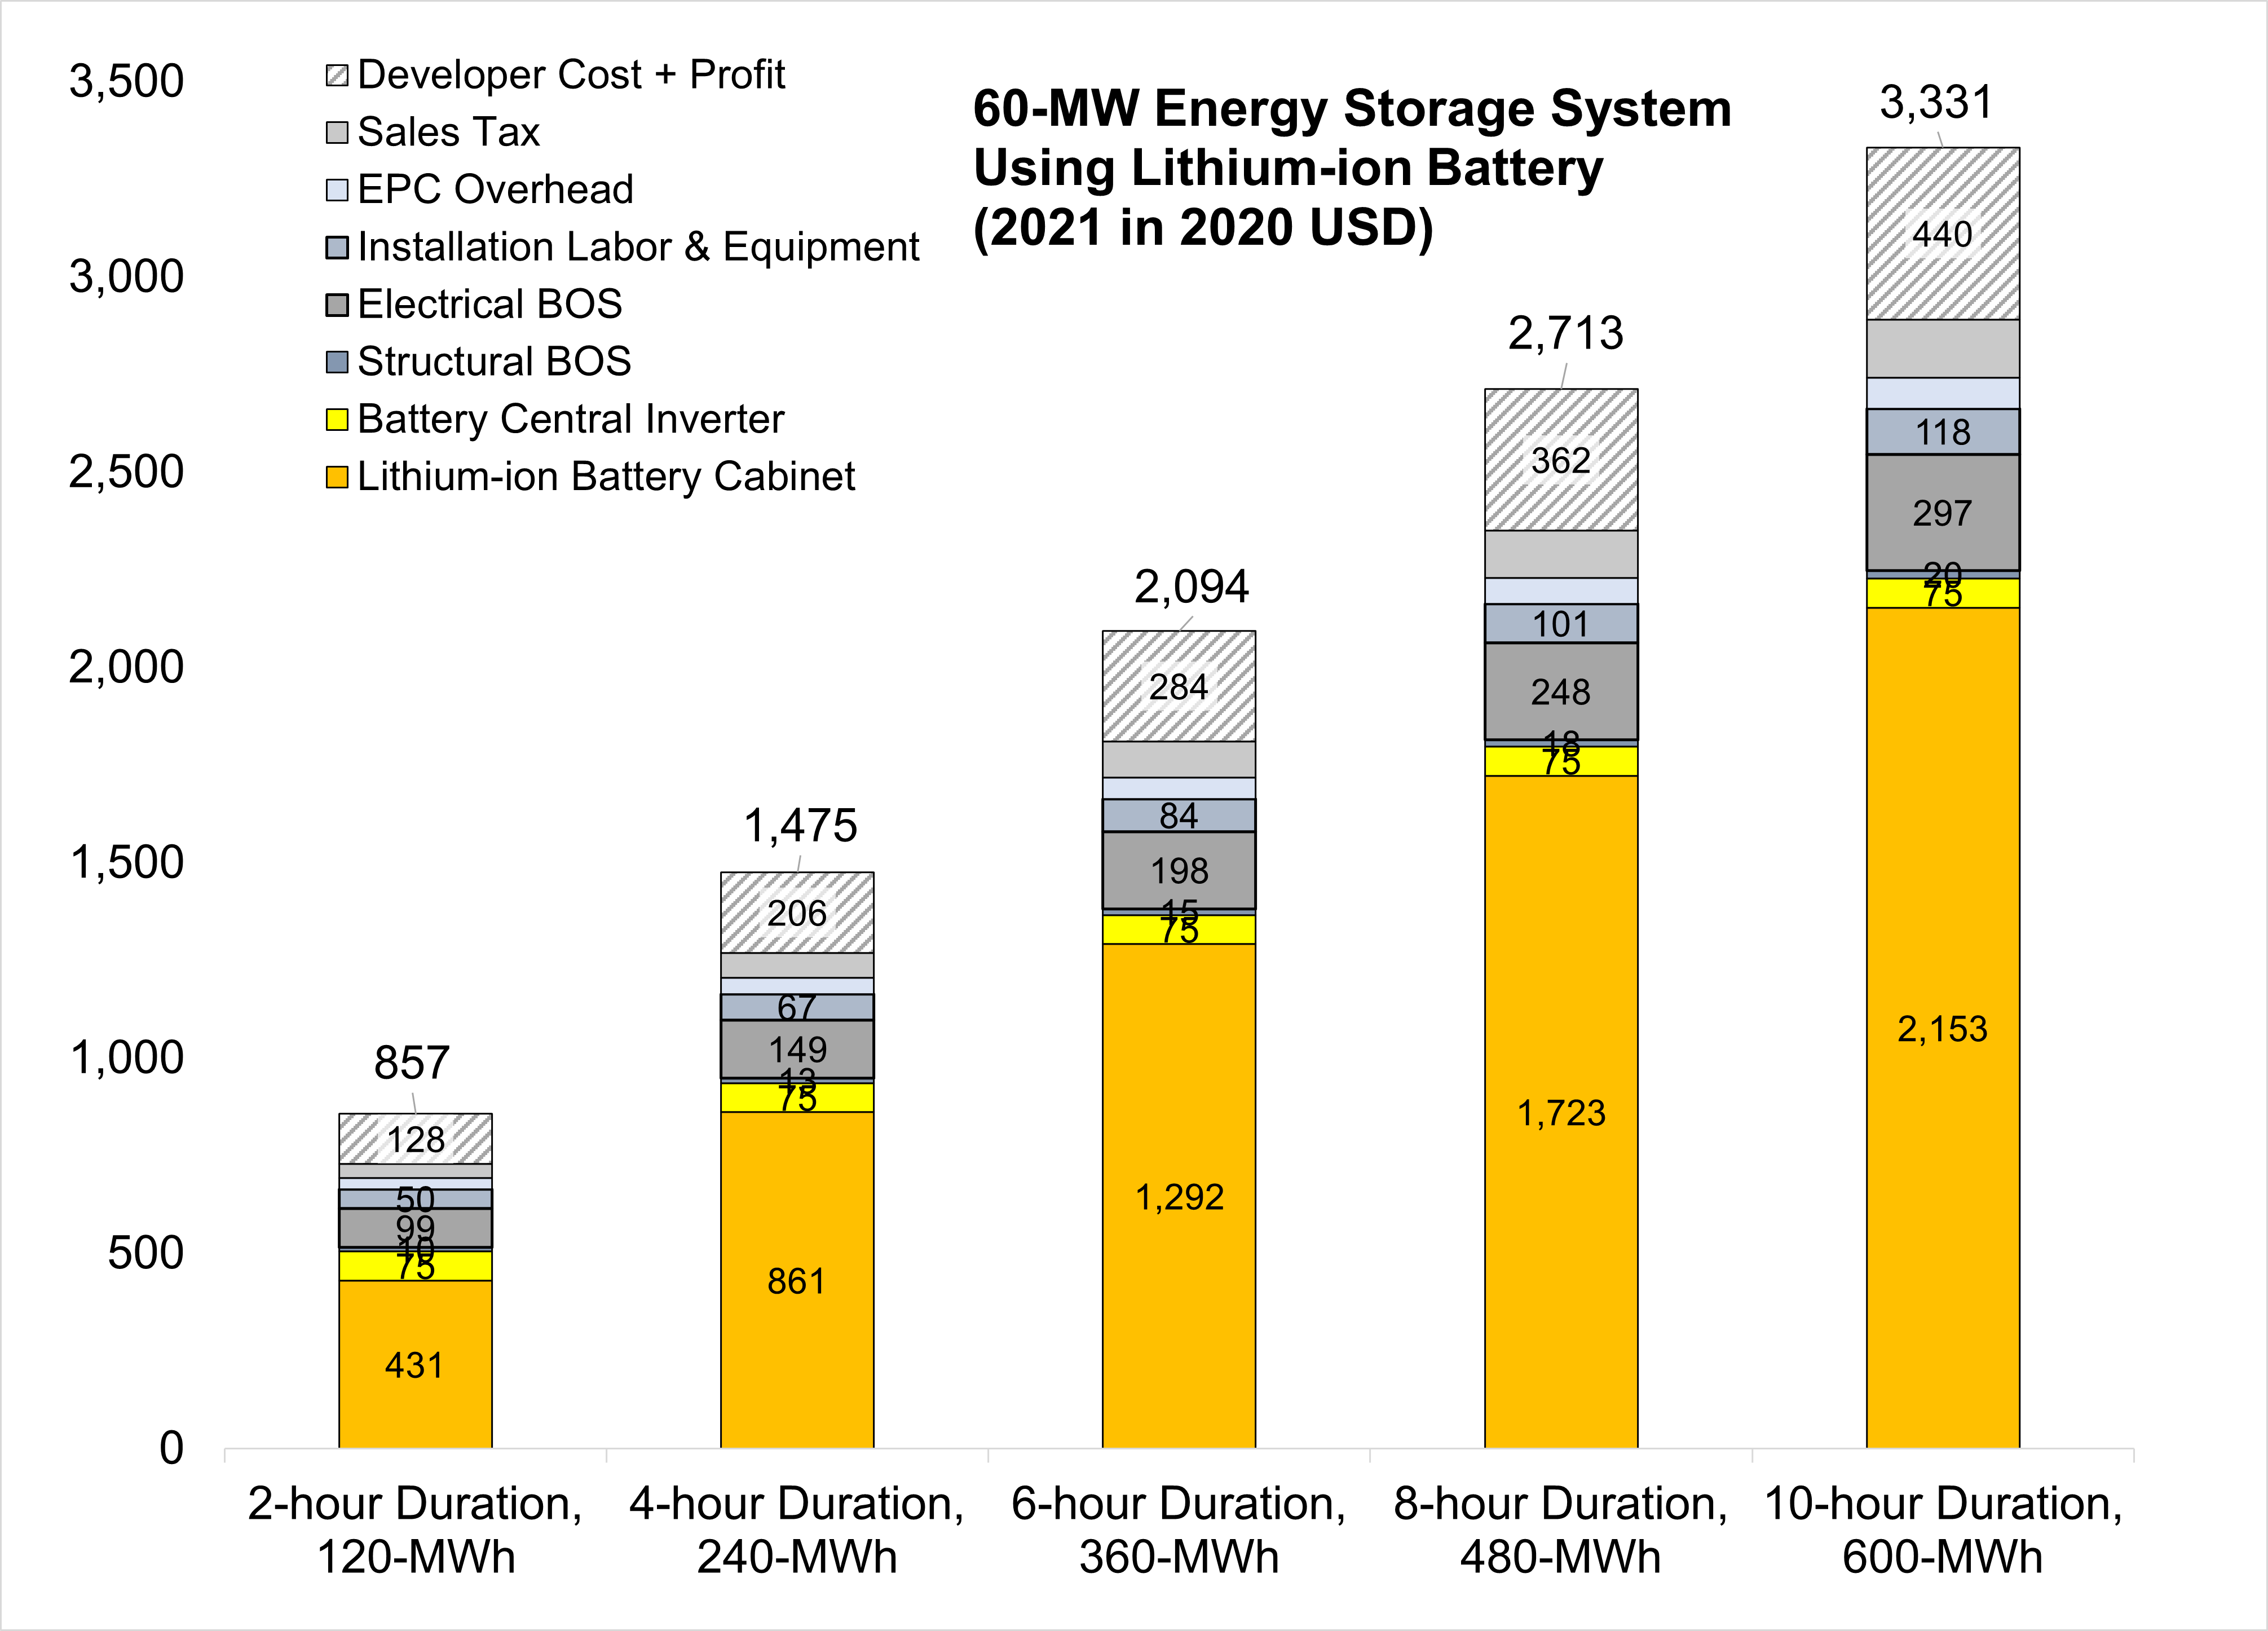
Base year costs for utility-scale battery energy storage systems (BESS) are based on a bottom-up cost model using the data and methodology for utility-scale BESS in (Ramasamy et al., 2021). The bottom-up BESS model accounts for major components, including the LIB pack, inverter, and the balance of system (BOS) needed for the installation. Using the detailed NLR cost models for LIB, we develop base year costs for a 60-MW BESS with storage durations of 2, 4, 6, 8, and 10 hours, shown in terms of energy capacity ($/kWh) and power capacity ($/kW) in Figure 1 and Figure 2 respectively. Base year installed capital costs for BESS in terms of $/kWh decrease with duration, and costs in $/kW increase. This inverse behavior is observed for all energy storage technologies and highlights the importance of distinguishing the two types of battery capacity when discussing the cost of energy storage.
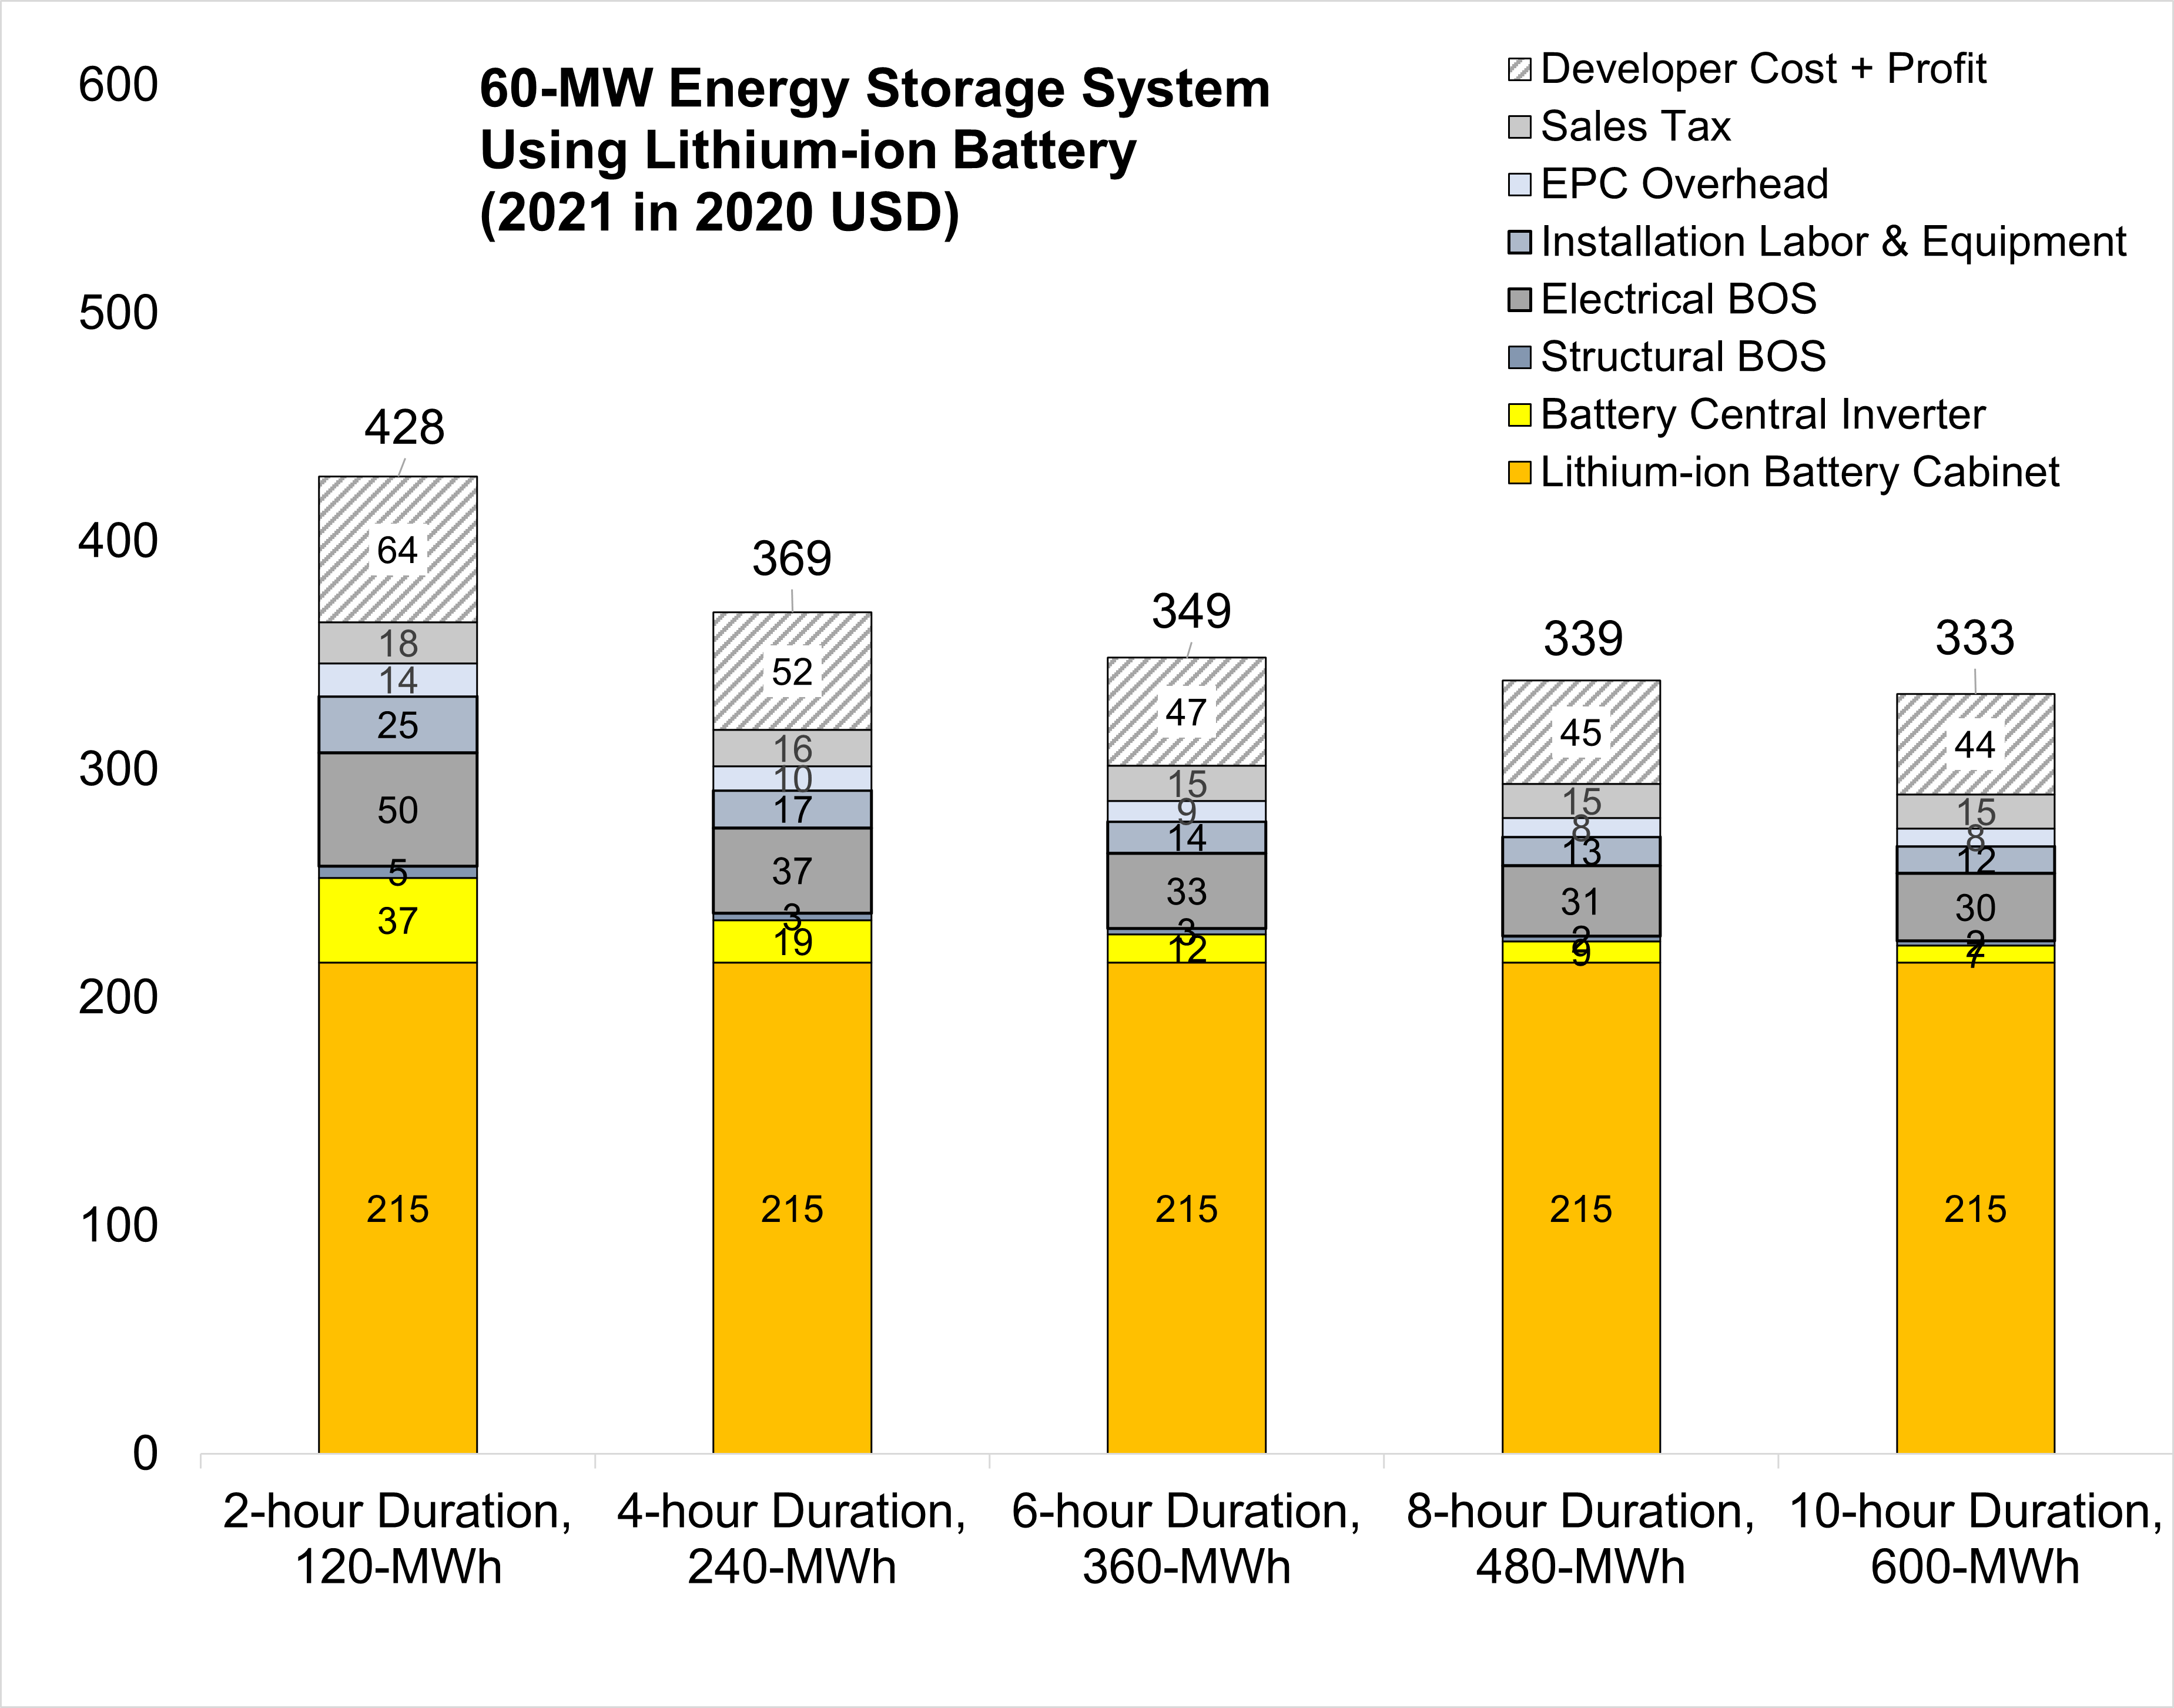
EPC: engineering, procurement, and construction
Scenario Descriptions
Battery cost and performance projections in the 2022 ATB were based on a literature review of 13 sources published in 2018 or 2019, as described by Cole et al. (Cole et al., 2021). Three projections from 2020 to 2050 are developed for scenario modeling based on this literature.
In all three scenarios of the scenarios described below, costs of battery storage are anticipated to continue to decline. The Storage Futures Study (Augustine and Blair, 2021) describes that the majority of this cost reduction comes from the battery pack cost component with minimal cost reductions in BOS, installation, and other components of the cost. The report indicates that NLR, BloombergNEF (BNEF), and others anticipate that the growth of the overall battery industry - across the consumer electronics sector, the transportation sector, and the electric utility sector - will lead to cost reductions. Additionally, BNEF and others indicate that changes in lithium-ion chemistry (such as switching away from cobalt) will also reduce cost. A third key factor is ongoing innovation with significant corporate and public research on batteries. Finally, the growth in the market (effective learning-by-doing) and more diversity of chemistries will expand and change the dynamics of the supply chain for batteries resulting in cheaper inputs to the battery pack (Mann et al., 2022).
- Conservative Technology Innovation Scenario (Conservative Scenario): The conservative projection is comprised of the maximum projection in 2020, 2025, and 2030 among the 13 cost projections from the literature review (Cole et al., 2021). Defining the 2050 points is more challenging because only four data sets of the 13 from the literature review extend to 2050; they show cost reductions of 19%, 25%, 27%, and 39% from 2030 to 2050. A 25% cost reduction is assumed for the Moderate and Conservative scenarios. In other words, the Conservative Scenario is assumed to decline by 25% from 2030 to 2050.
- Moderate Technology Innovation Scenario (Moderate Scenario): The moderate projections are taken as the median point in 2020, 2025, and 2030 of the 13 projections reviewed. Defining the 2050 points is more challenging because only four data sets of the 13 from the literature review extend to 2050; they show cost reductions of 19%, 25%, 27%, and 39% from 2030 to 2050. A 25% cost reduction is assumed for the Moderate and Conservative scenarios. In other words, the Moderate Scenario is assumed to decline by 25% from 2030 to 2050.
- Advanced Technology Innovation Scenario (Advanced Scenario): The advanced projections are taken as the lowest cost point in 2020, 2025, and 2030 from the 13 projections reviewed. Defining the 2050 points is more challenging because only four of the reviewed data sets extend to 2050; they show cost reductions of 19%, 25%, 27%, and 39% from 2030 to 2050. The 39% cost reduction is used for the Advanced Scenario. In other words, the Advanced Scenario is assumed to decline by 39% from 2030 to 2050.
Methodology
Projected Utility-Scale BESS Costs: Future cost projections for utility-scale BESS are based on a synthesis of cost projections for 4-hour duration systems in (Cole et al., 2021) and the BNEF cost projections for utility-scale BESS (BNEF, 2019b)(Frith, 2020). The Cole et al. cost projections are based on a literature survey that includes results from 13 studies of BESS costs. The BNEF cost projections are based on learning rates and deployment projections for utility-scale BESS that are broken down at the system component level. Both projections extend to 2050.
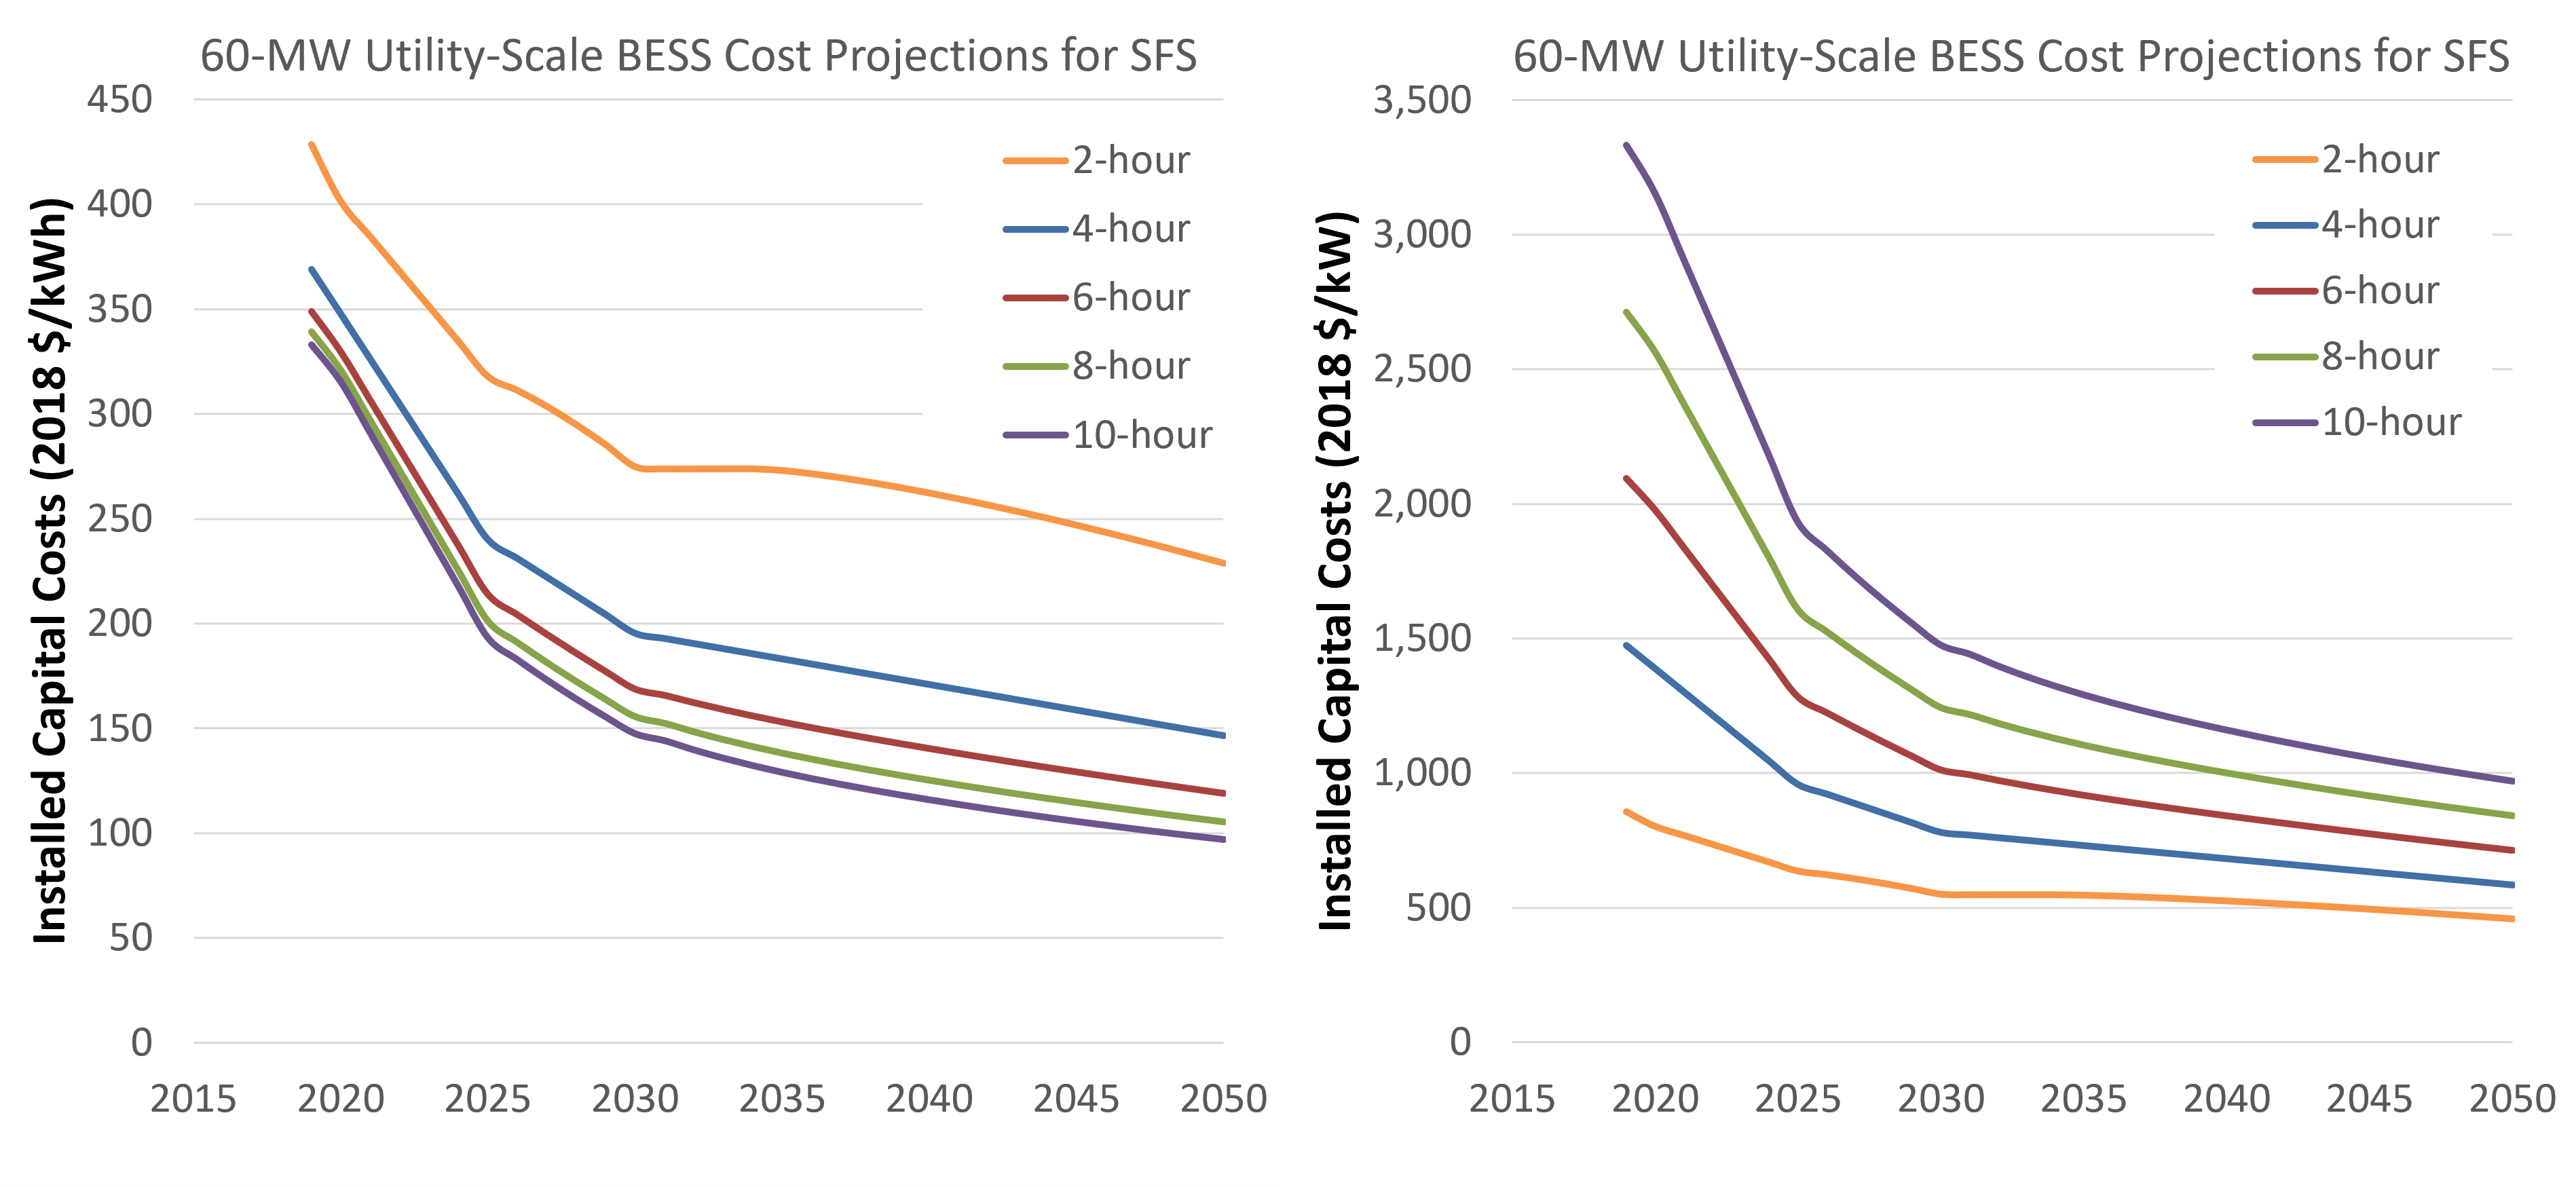
Projected costs for battery components tend to decrease much more quickly than projected costs for other system components such as the inverter, BOS, installation, and soft cost components (EPRI, 2018)(BNEF, 2019b)(BNEF, 2019a)(Schmidt et al., 2018). Thus, projected total system costs decrease more quickly for longer-duration battery storage than shorter-duration battery storage. However, the duration is not captured in the BNEF cost projections, which only project a 4-hour system. The (Cole et al., 2021) projections contain information for both power and duration, so costs can be calculated for any storage duration; however, they do not account for how different BESS component costs (particularly, the LIB pack cost) change over time. Therefore, to account for storage costs as a function of storage duration, we apply the BNEF battery cost reduction projections to the energy (battery) portion of the 4-hour storage and use the (Cole et al., 2021) summary for the remaining component costs to develop combined Moderate Scenario projections for future years. In this way, the cost projections capture the rapid projected decline in battery costs and account for component costs decreasing at different rates in the future. Figure 3 shows the resulting utility-scale BESS future cost projections for the Moderate Scenario for 2–10 hours in terms of both $/kWh and $/kW. For the Advanced and Conservative BESS cost scenarios, we apply the normalized cost reductions for the corresponding scenarios from (Cole et al., 2021) to the base year costs for all storage durations.
Capital Expenditures (CAPEX)
Definition: The bottom-up cost model documented by (Ramasamy et al., 2021) contains detailed cost components for battery only systems costs (as well as combined with PV). Though the battery pack is a significant cost portion, it is a minority of the cost of the battery system. These costs for a 4-hour utility-scale stand-alone battery are detailed in Table 1.
Current Year (2021): The 2021 cost breakdown for the 2022 ATB is based on (Ramasamy et al., 2021) and is in 2020$.
Within the ATB Data spreadsheet, costs are separated into energy and power cost estimates, which allows capital costs to be constructed for durations other than 4 hours according to the following equation:
Total System Cost ($/kW) = Battery Pack Cost ($/kWh) × Storage Duration (hr) + BOS Cost ($/kW)
For more information on the power versus energy cost breakdown, see (Cole et al., 2021) . For items included in CAPEX, see the table below.
Future Projections: Future projections are based on the same literature review data that inform (Cole et al., 2021) , which generally used the median of published cost estimates to develop a Moderate Technology Cost Scenario and the minimum values to develop an Advanced Technology Cost Scenario. However, as the battery pack cost is anticipated to fall more quickly than the other cost components (which is similar to the recent history of PV system costs), the battery pack cost reduction is taken from (BNEF, 2019b) and (Frith, 2020) and is reduced more quickly. This tends to make the longer-duration batteries (e.g., 10 hours ) decrease more quickly while shorter-duration batteries (e.g., 2 hours) decrease less quickly into the future. All durations trend toward a common trajectory as battery pack costs decrease into the future.
Operation and Maintenance (O&M) Costs
Base Year: (Cole et al., 2021) assume no variable O&M (VOM) costs. All operating costs are instead represented using fixed O&M (FOM) costs. The fixed O&M costs include battery replacement costs, based on assumed battery degradation rates that drive the need for 20% capacity augmentations after 10 and 20 years to return the system to its nameplate capacity (Ramasamy et al., 2021). The augmentations assume that 20% of the cells are replaced in each augmentation, with costs for battery cells and bidirectional inverters dropping 40% in the next 20 years. In the 2022 ATB, FOM is defined as the value needed to compensate for degradation to enable the battery system to have a constant capacity throughout its life. According to the literature review (Cole et al., 2021), FOM costs are estimated at 2.5% of the capital costs in dollars per kilowatt. Items included in O&M are shown in the table below.
Future Years: In the 2022 ATB, the FOM costs and the VOM costs remain constant at the values listed above for all scenarios.
Capacity Factor
The cost and performance of the battery systems are based on an assumption of approximately one cycle per day. Therefore, a 4-hour device has an expected capacity factor of 16.7% (4/24 = 0.167), and a 2-hour device has an expected capacity factor of 8.3% (2/24 = 0.083). Degradation is a function of this usage rate of the model and systems might need to be replaced at some point during the analysis period. We use the capacity factor for a 4-hour device as the default value for ATB due to anticipation that 4-hour durations are more typical in the utility-scale market.
Round-Trip Efficiency
Round-trip efficiency is the ratio of useful energy output to useful energy input. (Mongird et al., 2020) identified 86% as a representative round-trip efficiency, and the 2022 ATB adopts this value. In the same report, testing showed 83-87%, literature range of 77-98%, and a projected increase to 88% in 2030.
References
The following references are specific to this page; for all references in this ATB, see References.