Utility-Scale PV-Plus-Battery
The 2021 ATB presents data for a utility-scale PV-plus-battery technology (shown above) for the first time. Details are provided for a single configuration, and supplemental information is provided for a range of related configurations in order to reflect the uncertainty around the dominant architecture for coupled PV and battery systems (now and in the future). Base Year cost estimates rely on modeled capital expenditures (CAPEX) and operation and maintenance (O&M) costs benchmarked with industry and historical data. Capacity factor is estimated for 10 resource classes for the United States, which are binned by mean global horizontal irradiance (GHI), and based on assumptions regarding battery operation. Future year cost projections are derived from bottom-up benchmarking of utility-scale PV-plus-battery CAPEX and bottom-up engineering analysis of O&M costs, and future capacity factor estimates encompass a range of technology innovation scenarios for utility-scale PV and utility-scale battery storage.
Resource Categorization
The PV-plus-battery technology uses the same 10 resource categories as the utility-scale PV technology. See the Resource Categorization section of the utility-scale PV page for a description of these 10 resource categories.
Scenario Descriptions
Technology innovation scenarios for PV-plus-battery are a combination of utility-scale PV and utility-scale battery technology innovation scenarios (e.g., the Conservative Scenario for PV-plus-battery technology uses the Conservative Scenarios of both utility-scale PV and utility-scale battery technologies). See the Scenario Descriptions sections of the utility-scale PV and utility-scale battery storage pages for details.
Representative Technology
The utility-scale PV-plus-battery technology represents a DC-coupled system (defined in the figure below), in which one-axis tracking PV and 4-hour lithium-ion battery storage share a single bidirectional inverter. The PV-plus-battery technology is represented as having a 130-MWDC PV array, a 50-MWAC battery (with 4-hour duration), and a shared 100-MWAC inverter. Therefore, the PV component has a DC-to-AC ratio (or inverter loading ratio [ILR]) of 1.3, which is the same as for utility-scale PV in the 2021 ATB. The assumed relative sizing is consistent with existing (but limited) data for online and proposed utility-scale PV-plus-battery systems—whose inverter characteristics (shared vs. separate) are not well known.
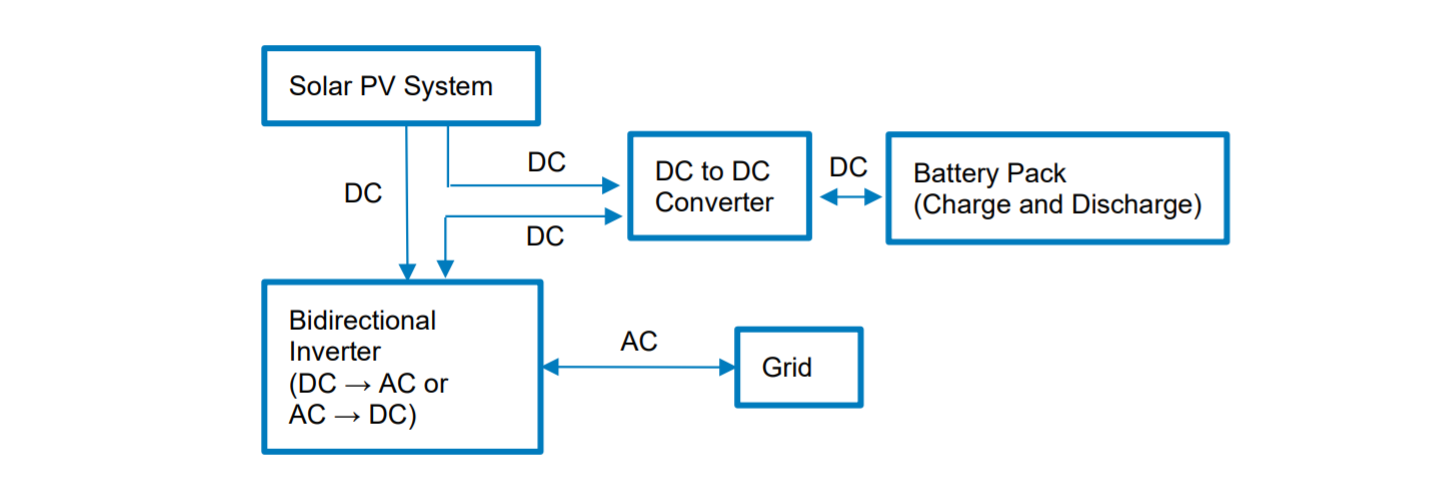
Source: (Feldman et al., 2021)
The dominant architecture for proposed and future utility-scale PV-plus-battery systems is highly uncertain. Interconnection queue data for most market regions do not include detailed information about inverter characteristics for proposed projects (Bolinger et al., 2020). Moreover, the highest-value architecture will likely evolve over time based on future changes in the grid mix, the performance characteristics of key hybrid components (e.g., bidirectional inverters and DC-to-DC converters), and federal incentives. Within the context of this uncertainty, we chose a DC-coupled configuration for the default utility-scale PV-plus-battery technology because of characteristics that make the coupled system distinct from multiple separate systems:
- DC coupling enables operational synergies such as (1) increased round-trip efficiency when the battery charges from the coupled PV and (2) the ability to capture energy that would otherwise be clipped by the inverter or lost due to low-voltage conditions (e.g., during sunrise/sunset and hours with significant cloud cover).
- Cost implications for DC-coupled systems are complex: such systems require only one shared inverter (which presents a cost savings), but they require additional DC-to-DC converters and could require more sophisticated control systems to co-optimize the utilization of both the PV and battery components (which presents a cost increase).
- The design of DC-coupled systems is complex and integrated, largely because the battery racks are distributed throughout the PV field, leading to a greater number of smaller battery racks and, therefore, higher structural balance of system (BOS), electrical BOS, labor, and O&M costs relative to colocated systems. For example, these distributed battery racks require more individual thermal energy management and fire suppression systems than what would be needed with the larger, centralized battery racks found in colocated systems.
Methodology
This section describes the methodology to develop our reported CAPEX, O&M, and capacity factor values. For assumptions that are standardized for all technologies in the 2021 ATB, see labor cost, regional cost variation, materials cost index, scale of industry, policies and regulations, and inflation.
Utility-scale PV-plus-battery projections are driven primarily by CAPEX cost improvements, along with improvements in energy yield, operational cost, and cost of capital (for the Market + Policies Financial Assumptions Case). For more information, see the Financial Cases and Methods page.
Though CAPEX is one driver of cost reductions over time, R&D efforts continue to focus on other areas to lower the cost of energy from utility-scale PV-plus-battery, such as longer system lifetime and improved performance. Three 2030 projections are developed for scenario modeling as bounding levels:
- Conservative Technology Innovation Scenario (Conservative Scenario): lower levels of R&D investment with minimal technology advancement and current global component pricing
- Moderate Technology Innovation Scenario (Moderate Scenario): R&D investment continuing at similar levels as today, with current industry technology road maps achieved but no substantial innovations or new technologies introduced to the market
- Advanced Technology Innovation Scenario (Advanced Scenario): an increase in R&D spending that generates substantial innovation, allowing historical rates of development to continue.
A primary motivation for utility-scale PV-plus-battery systems is the potential for the battery component to qualify for the federal investment tax credit (ITC). The battery component’s ability to qualify for the ITC (partially or fully) affects both its costs and capacity factor, so we briefly describe its application here.
We assume 75% of the energy used to charge the coupled 4-hour battery storage (on an annual basis) is derived from the local PV, which corresponds to the minimum charging requirement for the battery component’s ITC qualification. We assume only partial (as opposed to full) ITC qualification in order to represent a more realistic capacity factor over the lifetime of a project—ITC-related operational requirements apply only to the first 5 years of operations, after which charging from the grid may represent an important source of value. Following from this assumption, LCOE projections under the Market + Policies Financial Assumptions Case reflect capital cost savings and financing terms shown in the following figure and capacity factors that follow from our charging assumptions.
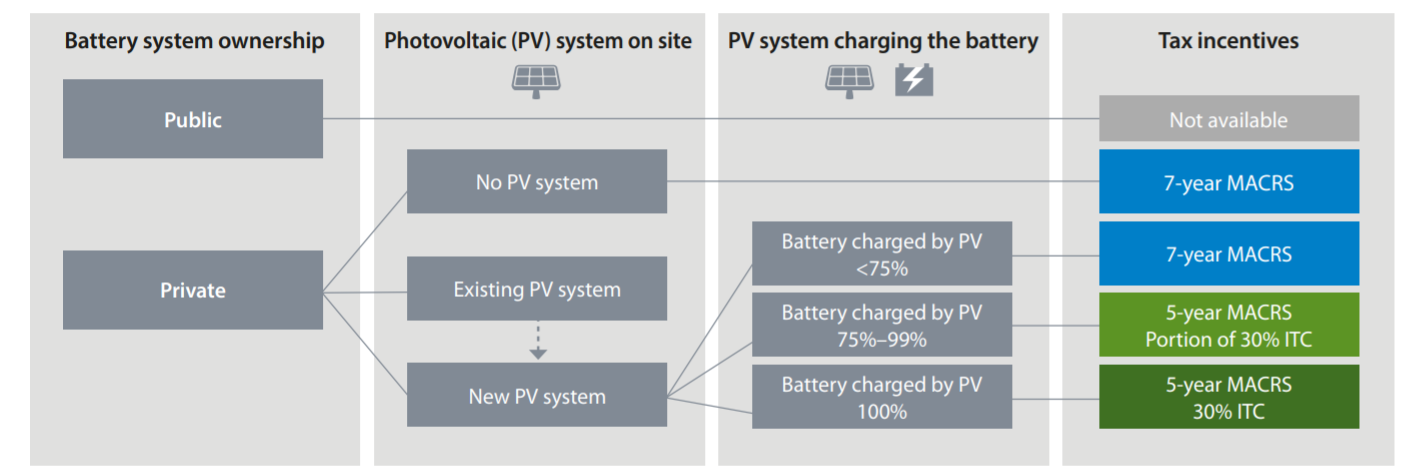
Source: (Elgqvist et al., 2018)
Capital Expenditures (CAPEX)
The 2021 ATB assumes current estimates and future projections have fixed component sizing that is consistent with the description in the Representative Technology section. Plant costs are represented with a single estimate per innovation scenario because CAPEX does not correlate well with solar resource.
In general, our cost assumptions for utility-scale PV-plus-battery are rooted in those for the independent utility-scale PV and 4-hour battery storage technologies. Therefore, our primary contribution is to capture the cost factors that are influenced by the coupling of utility-scale PV and battery technologies, including its influence on site preparation, land acquisition, hardware, installation labor, and interconnection and permitting costs, among others. CAPEX and O&M costs do not include augmentation costs required to compensate for battery degradation and maintain battery capacity over the lifetime of the PV-plus-battery system.
Base Year: The Base Year (2019) cost estimate is developed using the bottom-up cost modeling method from NLR's U.S. Solar Photovoltaic System and Energy Storage Cost Benchmark: Q1 2020 (Feldman et al., 2021).
The detailed cost information provided is based on our default configuration (with an ILR of 1.3 based on the PV component only and a 4-hour battery storage component), which is designed to be consistent with what is known about recent and proposed utility-scale PV-plus-battery projects (Bolinger et al., 2020). However, it is ultimately expected that DC-coupled PV-plus-battery systems will trend toward higher ILRs (and longer-duration batteries) because of the incremental value associated with the recovery of clipped energy and the enhanced capacity credits. Under such a configuration, select cost categories would scale with the size of the PV arrays, which define the ILR; for details, see the Comparison with Alternate Configurations section.
Future Projections: Future projections of the CAPEX associated with our utility-scale PV-plus-battery technology combine the projections for utility-scale PV and utility-scale battery storage technologies (with 4-hour storage duration). The technological innovations achieved for utility-scale PV-plus-battery systems (by scenario) are the same as those achieved for utility-scale PV systems in the areas of module efficiency, inverter power electronics (including bidirectional battery inverters), and installation and hardware BOS efficiency improvements.
The cost declines of the lithium-ion battery component in the PV-plus-battery systems were calculated using the relative cost declines between 2020 and 2030, by scenario, of the 4-hour battery storage CAPEX in the utility-scale battery storage section of the 2021 ATB (and 2050 for the advanced case). Like the utility-scale PV section, we assume each scenario's 2050 CAPEX is the equivalent of the 2030 CAPEX of the scenario but one degree more aggressive, with a straight-line change in price in the intermediate years between 2030 and 2050. We also develop and model a scenario one degree more aggressive than the Advanced Scenario to estimate its 2050 CAPEX.
| Year | Advanced (Increased R&D) | Moderate (Current R&D) | Conservative (Decreased R&D) |
| 2030 | * $853/kWAC | † $1,057/kWAC | $1,537/kWAC |
| 2050 | $619/kWAC | * $853/kWAC | † $1,057/kWAC |
More aggressive scenarios reach given CAPEX sooner, as indicated by the asterisks and daggers
The rated capacity in the denominator is reported in terms of the capacity of the shared central inverter, which sets the maximum AC power output of the plant.
Operation and Maintenance (O&M) Costs
Operation and maintenance (O&M) costs represent the annual fixed expenditures required to operate and maintain a PV-plus-battery plant over its lifetime, and they are rooted in the O&M costs reported for utility-scale PV and utility-scale battery storage technologies. Variable O&M costs for the battery component are likely to be nonzero because of the cycle degradation typical of lithium-ion battery storage; however, all our assumed O&M costs are fixed in nature (as opposed to variable), which is consistent with those reported for independent battery storage.
Capacity Factor
The capacity factor represents the expected annual average energy production divided by the maximum annual energy production if the plant were to operate at rated capacity (the bidirectional inverter capacity in this case) for every hour of the year. Capacity factor is intended to represent a long-term average over the lifetime of the plant; it does not represent inter-annual variation in PV energy production or in battery charging/discharging behavior based on changing electricity prices. Future year estimates represent the estimated annual average capacity factor over the technical lifetime of a new plant installed in a given year.
The capacity factor of the utility-scale PV-plus-battery system is a function of the capacity factors of the PV and battery components, assuming a certain amount (Y% in the figure below) of the battery energy is charged from the coupled PV. The PV capacity factor is based on the 10 resource categories as described in the Capacity Factor section of the utility-scale PV page. The battery capacity factor is based on one cycle per day (4 hr/24 hr = 16.7%) as described in the Capacity Factor section of the utility-scale battery storage page (for a 4-hour duration system). These values, shown in the gray boxes below, are directly tied to independent utility-scale PV and utility-scale battery technologies, and they do not change as a function of the user-defined Y% .
The total energy output is the sum of the PV energy that goes directly to the grid and the battery energy that is discharged to the grid. This total energy output is dictated by the user-defined Y% (i.e., the shares of PV and grid charging), which influences the capacity factor of the utility-scale PV-plus-battery system.
The battery efficiency depends on the source of charging: we assume 85% round-trip efficiency when charging from the grid, and 87% efficiency when charging from the coupled PV (because of avoided AC/DC conversions in the latter case). In the figure below, RTE (round-trip efficiency) refers to the efficiency when charging from the coupled PV. These RTE values remain unchanged through 2050.
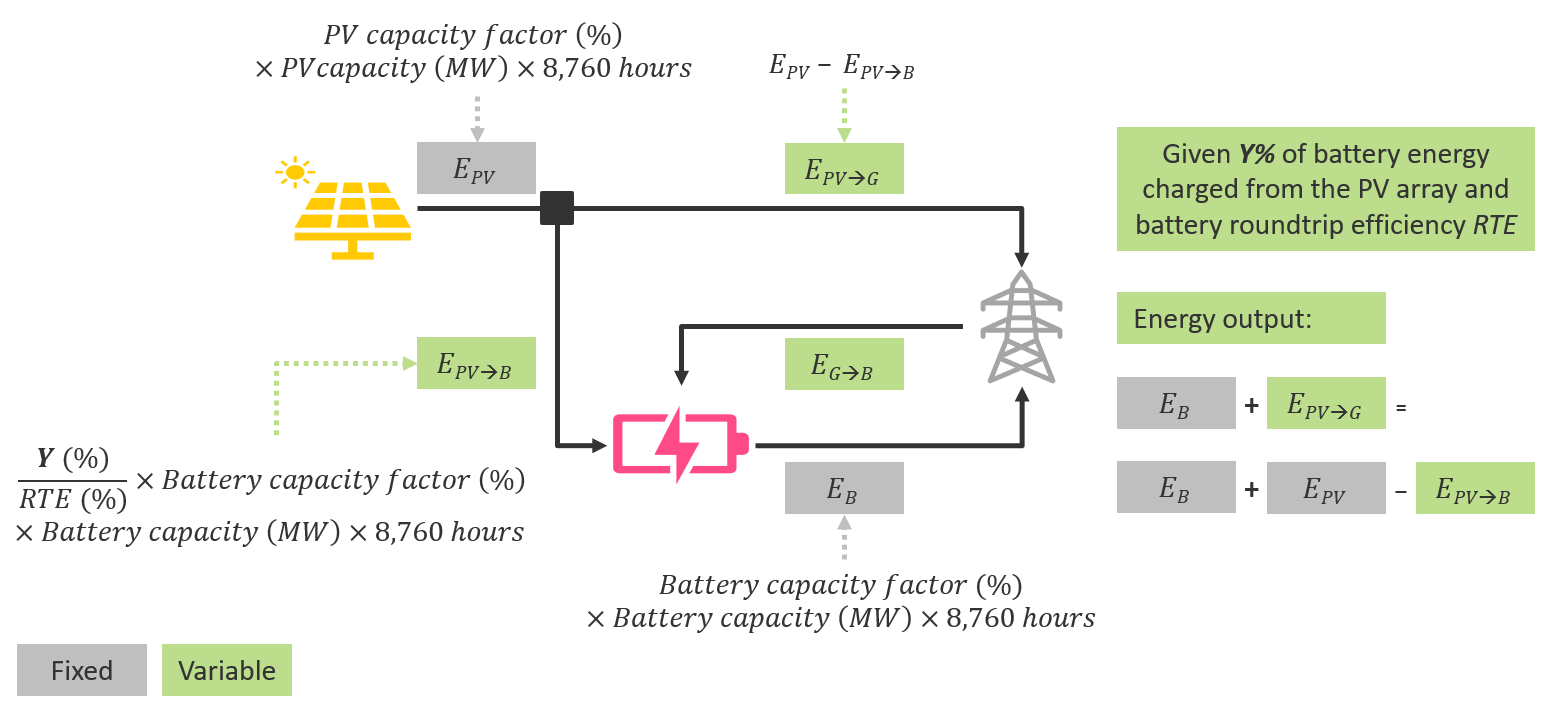
The energy flows in the above figure are:
- EPV: energy generated by the PV array
- EPV–>G: energy generated by the PV array that is sent directly to the grid
- EPV–>B: energy generated by the PV array that is sent to the battery
- EB: energy discharged from the battery to the grid
- EG–>B: energy charged to the battery from the grid.
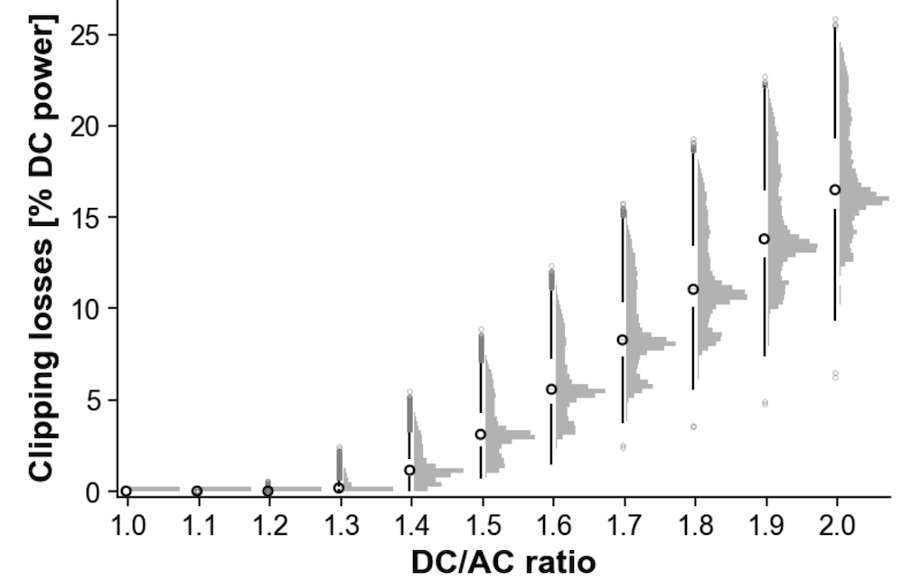
Finally, a benefit of DC-coupling is the PV-plus-battery system's ability to use energy that would otherwise be lost in the absence of the DC-coupled battery (e.g., energy clipped by the inverter during times when the DC power from the PV array exceeds the rating of the inverter). However, the figure below indicates the amount of clipped energy for our representative technology is 0.0%–0.5% of the DC electricity produced by the PV array in the majority of the conterminous United States. Therefore, we assume the increase in capacity factor that is due to the DC-coupled system's ability to capture otherwise clipped energy is negligible for our representative technology, but we discuss the greater potential for capacity factor increases in systems with increasing ILRs in the Comparison with Alternate Configurations section below.

Source: (Eurek et al., 2021)
Impacts of Grid Charging on LCOE
The LCOE of our DC-coupled PV-plus-battery technology is rooted in the CAPEX costs, O&M costs, and capacity factor descriptions above. It also depends on the user-defined Y%, which influences both the capacity factor and the CAPEX (in the Market + Policies Financial Assumptions Case, based on ITC qualification of the battery component).
The default LCOE calculation does not include a cost of grid charging because generalizing the cost of energy purchased from the grid is difficult; for example, grid charging costs will likely be lower in locations and years with higher deployment of variable renewable energy technologies, as they will likely see higher levels of curtailment. Users can insert a static, average cost of grid charging that is unchanged over time and location. Every $10/MWh increase in this average grid charging cost increases the LCOE by approximately $3/MWh, assuming 25% of the battery's energy comes from the grid, subject to a round-trip efficiency of 85% (25% * $10/MWh / 85% = $2.94/MWh).
While the LCOE of our utility-scale PV-plus-battery technology is informative on its own, a comparison with the LCOE for utility-scale PV provides insights into the incremental value associated with DC coupling. The observed difference in LCOE between utility-scale PV-plus-battery and utility-scale PV technologies (for a given year and resource bin) is roughly in line with empirical power purchase agreement price data for PV-plus-battery systems with comparable battery sizes (Bolinger et al., 2020). However, it is important to note there are inherent differences between LCOE and PPA price metrics, as the latter is influenced by factors that are not strictly based on costs or energy production (e.g., capacity payments, renewable energy certificates, and strategic bidding,).
Comparison with Alternate Configurations
As previously noted, the dominant architecture and component sizing for utility-scale PV-plus-battery technologies are highly uncertain for both proposed and future projects. Therefore, we provide users with cost and performance information for alternate PV-plus-battery configurations, including a DC-coupled PV-plus-battery configuration with a higher ILR and a representative AC-coupled PV-plus battery configuration.
DC-coupled PV-plus-battery systems with higher ILRs will have higher total energy output because of the additional (DC) capacity of the PV array; without a DC-coupled battery, this additional energy would be clipped by the inverter, as shown in the figure below. Applying the same bottom-up cost modeling method to a DC-coupled PV-plus-battery system with an ILR of 1.7 (with the remaining component sizes fixed), the total cost increases because of greater PV module, electrical and structural BOS, labor, and other soft costs. The table below presents a detailed cost breakdown, which reveals that approximately half the cost increase is due to the greater PV module costs.
In an AC-coupled configuration, the PV and battery components operate through separate inverters. This has important implications for non-inverter cost categories, as it influences the design, layout, and complexity associated with project installation. Details are provided in the figure and table below.
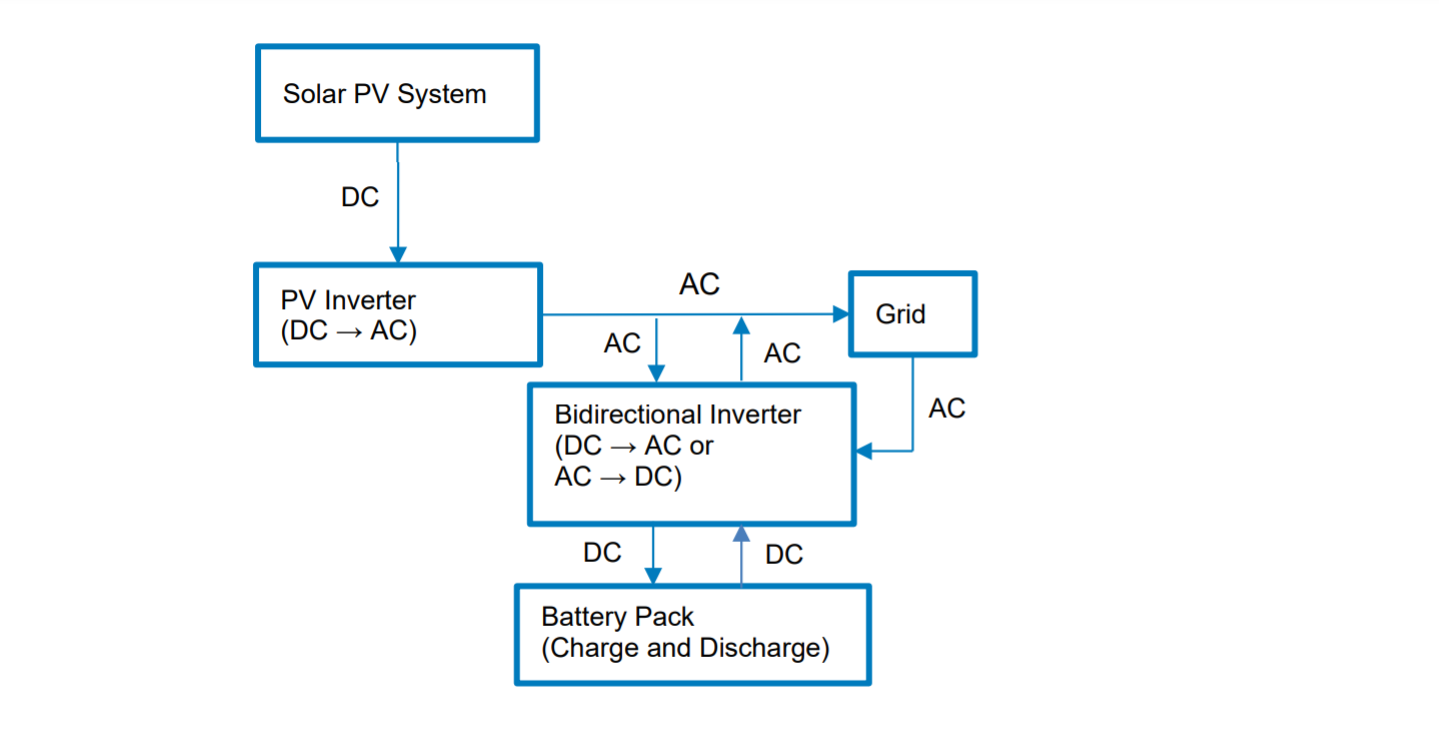
Source: (Feldman et al., 2021)
| Model Component | DC-Coupled Configuration | AC-Coupled Configuration |
|---|---|---|
| Number of inverters | 1 (bidirectional inverter) | 2 (bidirectional inverter for battery plus PV inverter), resulting in higher inverter, inverter wiring, and inverter housing costs |
| Battery rack size | Smaller (because battery is directly connected to PV), resulting in more HVAC and fire-suppression systems required | Larger |
| Structural BOS | More (due to smaller battery rack size) | Less |
| Electrical BOS | More (due to additional DC-DC converters and associated wiring) | Less |
| Installation labor cost | More (due to smaller battery rack size and more skilled labor and labor hours required for DC work) | Less |
| EPC (engineering, procurement, and construction) overhead | More (due to higher installation labor costs) | Less |
| Sales tax | Less | More (due to higher total hardware costs) |
| EPC/developer profit | Less | More (due to higher total EPC and developer costs) |
Adapted from: (Feldman et al., 2021)
To facilitate comparison with the default configuration presented in the 2021 ATB, we assign the same component capacities to the representative AC-coupled configuration. However, instead of sharing a bidirectional inverter, the PV component has its own 100-MWAC inverter (unidirectional) and the battery storage has a separate 50-MWAC bidirectional inverter. In turn, the representative AC-coupled PV-plus-battery technology has the potential for a maximum power output of 150 MWAC. That being said, the total output will ultimately be dictated by the interconnection capacity (or limit), which may be lower than the total inverter capacity in an AC-coupled system if the goal is to maximize use of the interconnection limit (Bolinger et al., 2020). In the absence of more clarity on current and future systems, we present cost information for AC-coupled systems in which the interconnection capacity is equal to the PV inverter capacity in order to facilitate a more direct comparison with the default DC-coupled configuration.
These cost estimates are based on the bottom-up cost modeling method from NLR's U.S. Solar Photovoltaic System and Energy Storage Cost Benchmark: Q1 2020 (Feldman et al., 2021).
Note: Interconnection and transmission costs would likely change for an AC-coupled system with an interconnection capacity equal to the sum of the PV and battery inverters.
Finally, an AC-coupled system would have a lower charging efficiency (than our default DC-coupled configuration) because of the multiple AC/DC conversions required to charge the battery component from either the coupled PV or the grid. For the representative AC-coupled configuration presented here, the RTE for any charging source would be equivalent to that of our default DC-coupled configuration when charging from the grid (85%), which is slightly lower than that of our default DC-coupled configuration when charging from the coupled PV (87%).
References
The following references are specific to this page; for all references in this ATB, see References.