Commercial Battery Storage
The 2021 ATB represents cost and performance for battery storage across a range of durations (1–8 hours). It represents lithium-ion batteries only at this time. There are a variety of other commercial and emerging energy storage technologies; as costs are well characterized, they will be added to the ATB.
The NLR Storage Futures Study has examined energy storage costs broadly and specifically the cost and performance of lithium-ion batteries (LIBs) (Augustine and Blair, 2021). The costs presented here (and on the distributed residential storage and utility-scale storage pages) are based on this work. This work incorporates current battery costs and breakdowns from (Feldman et al., 2021), which works from a bottom-up cost model. The bottom-up battery energy storage systems (BESS) model accounts for major components, including the LIB pack, inverter, and the balance of system (BOS) needed for the installation. We would note though that, during the elapsed time between the calculations for the Storage Futures Study and the ATB release, updated values have been calculated as more underlying data have been collected. While these changes are small, we recommend using the data presented here in the ATB rather than what was previously published with the Storage Futures Study.
Current costs for commercial and industrial BESS are based on NLR's bottom-up BESS cost model using the data and methodology of (Feldman et al., 2021), who estimated costs for a 600-kWDC stand-alone BESS with 0.5–4.0 hours of storage. We use the same model and methodology but do not restrict the power and energy capacity of the BESS. Feldman et al. assumed an inverter/storage ratio of 1.67 based on guidance from (Denholm et al., 2017). We adopt this assumption, too.
Key modeling assumptions and inputs are shown in the Table 1. Because we do not have battery costs that are specific to commercial and industrial BESS, we use the battery pack costs from (Feldman et al., 2021), which vary depending on the battery duration. These battery costs are close to our assumptions for battery pack costs for residential BESS at low storage durations and for utility-scale battery costs for utility-scale BESS at long durations. The underlying battery costs in Feldman et al. come from (Bloomberg New Energy Finance (BNEF), 2019a) and should be consistent with battery cost assumptions for the residential and utility-scale markets.
| Model Component | Modeled Value | Description |
| System size | 60–1,200 kWDC power capacity 1–8 E/P ratio | Battery capacity is in kWDC. E/P is battery energy to power ratio and is synonymous with storage duration in hours. |
| LIB price | 0.5-hr: $246/kWh 1-hr: $227/kWh 2-hr: $202/kWh 4-hr: $198/kWh | Ex-factory gate (first buyer) prices (Feldman et al., 2021) |
| Inverter/storage ratio | 1.67 | Ratio of inverter power capacity to storage battery capacity (Denholm et al., 2017) |
| Battery central inverter price | $61/kW | Ex-factory gate (first buyer) prices |
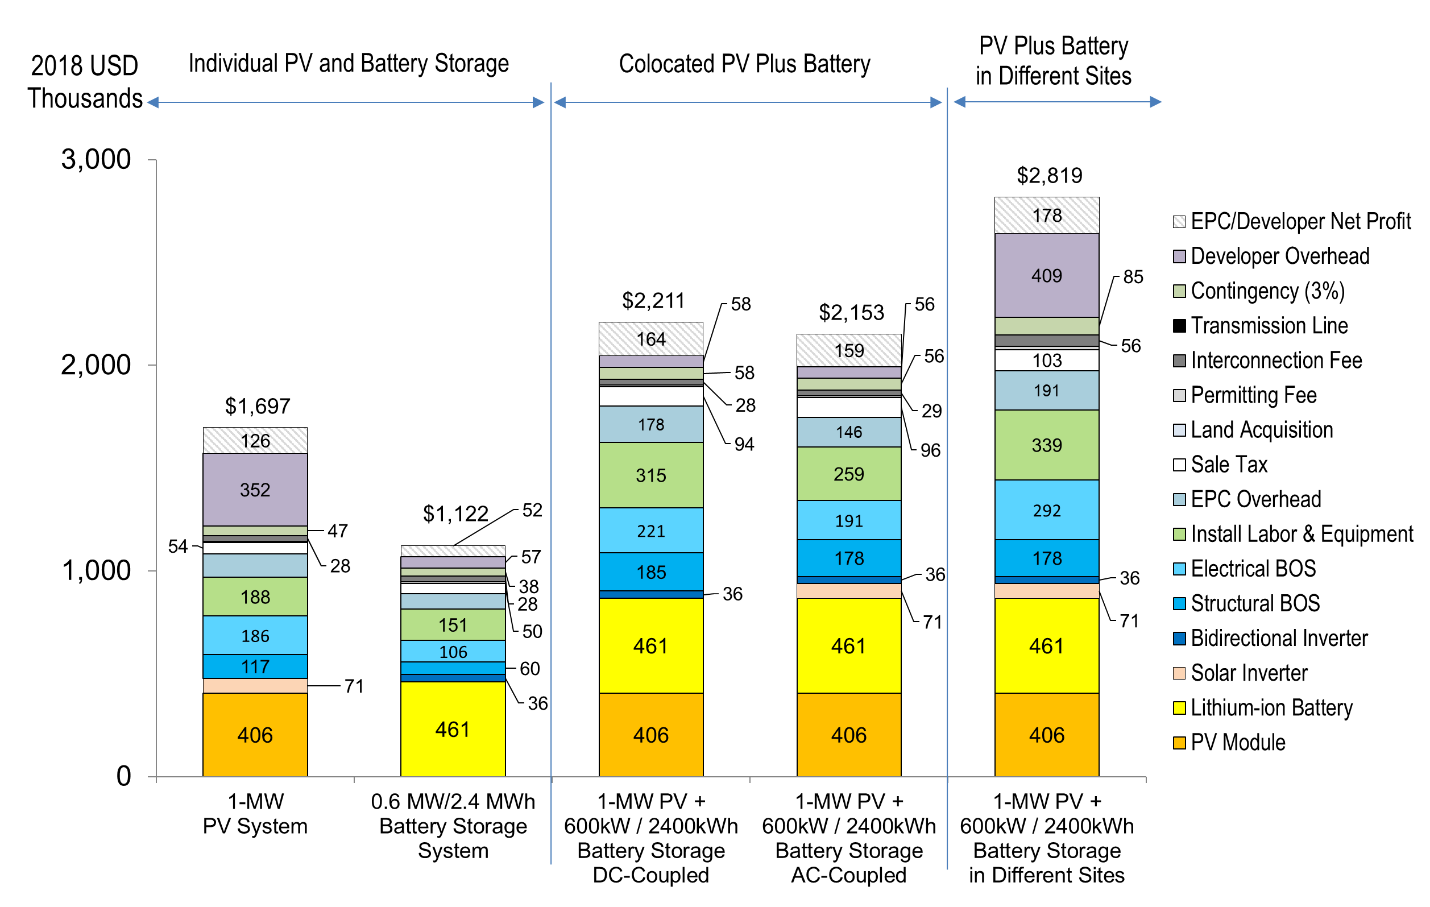
We also consider the installation of commercial and industrial PV systems combined with BESS (PV+BESS) systems (Figure 1). Costs for commercial and industrial PV systems come from NLR's bottom-up PV cost model (Feldman et al., 2021). We assume an inverter/load ratio of 1.3, which when combined with an inverter/storage ratio of 1.67 sets the BESS power capacity at 60% of the installed PV capacity. As with residential PV+BESS, we include cost savings for a combined PV and battery storage system. We assume the electrical BOS and installation labor are 90% of what they would be if the systems were installed separately. We also assume the sales and marketing costs for PV+BESS include 20 more hours for a DC-coupled system and 32 more hours for an AC-coupled system than would be included for a PV-only system installation.
Scenario Descriptions
Available cost data and projections for distributed battery storage are very limited. Therefore, the battery cost and performance projections in the 2021 ATB are based on the same literature review as for utility-scale and residential battery cost projections. The projections are based on a literature review of 19 sources published in 2018 or 2019, as described by (Cole and Frazier, 2020). Three projections from 2019 to 2050 are developed for scenario modeling based on this literature.
- Conservative Technology Innovation Scenario (Conservative Scenario):The conservative projection is comprised of the the maximum projection in 2020, 2025, and 2030 amongst the 19 cost projections from the literature review. Defining the 2050 points is more challenging because only four data sets extend to 2050; they show cost reductions of 19%, 25%, 27%, and 39% from 2030 to 2050. The 25% is used for the moderate and conservative scenarios. In other words, the Conservative Scenario is assumed to decline by 25% from 2030 to 2050.
- Moderate Technology Innovation Scenario (Moderate Scenario): The moderate projections are taken as the as the median point in 2020, 2025, and 2030 of the 19 projections reviewed. Defining the 2050 points is more challenging because only four data sets extend to 2050; they show cost reductions of 19%, 25%, 27%, and 39% from 2030 to 2050. The 25% is used for the moderate and conservative cases. In other words, the Moderate Scenario is assumed to decline by 25% from 2030 to 2050.
- Advanced Technology Innovation Scenario (Advanced Scenario): The advanced projections are taken as the as the lowest cost point in 2020, 2025, and 2030 of the 19 projections reviewed. Defining the 2050 points is more challenging because only four data sets extend to 2050; they show cost reductions of 19%, 25%, 27%, and 39% from 2030 to 2050. The 39% is used for the Advanced Scenario. In other words, the Advanced Scenario is assumed to decline by 39% from 2030 to 2050.
Methodology
Future cost projections for commercial and industrial BESS and PV+BESS are made using the same methodology as is used for residential BESS and PV+BESS. The normalized cost reduction projections for LIB packs used in residential BESS by (Mongird et al., 2020) are applied to future battery costs, and cost reductions for other BESS components use the same cost reduction potentials in Figure 2. Costs for commercial and industrial PV systems come from the 2020 ATB Moderate and Advanced Scenarios). We could not find projected costs for commercial and industrial BESS in the literature for comparison.
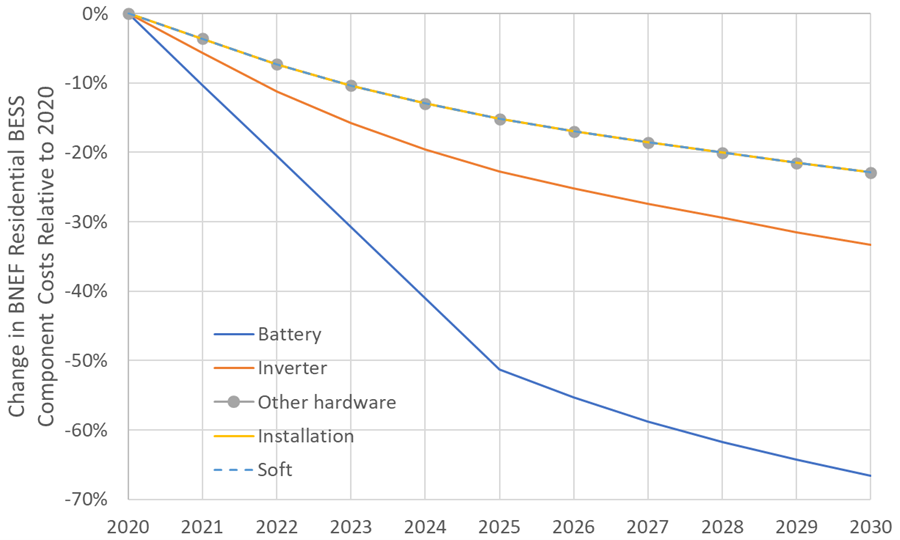
Data Source: (Bloomberg New Energy Finance (BNEF), 2019a)
Capital Expenditures (CAPEX)
Definition: The bottom-up cost model documented by (Feldman et al., 2021) contains detailed cost buckets for both solar only, battery only, and combined systems costs. Though the battery pack is a significant cost portion, it is a minority of the cost of the battery system. This cost breakdown is different if the battery is part of a hybrid system with solar PV or a stand-alone system. These relative costs for commercial scale stand-alone battery are demonstrated in Table 2.
| Model Component | $/kWh | $/kW |
| Lithium-ion battery | 192 | 768 |
| Battery central inverter | 15 | 59 |
| Structural BOS | 26 | 102 |
| Electrical BOS | 48 | 191 |
| Installation labor and equipment | 68 | 272 |
| EPC (engineering, procurement, and construction) overhead | 37 | 148 |
| Sale Tax | 18 | 70 |
| ∑ EPC Cost | 403 | 1611 |
| Land acquisition | 0 | 0 |
| Permitting fee | 3 | 12 |
| Interconnection fee | 11 | 46 |
| Contingency | 16 | 65 |
| Developer overhead | 24 | 97 |
| EPC/developer net profit | 22 | 89 |
| ∑ Developer cost | 78 | 310 |
| ∑ Total energy storage system cost | 480 | 1921 |
Base Year: The Base Year cost estimate is taken from (Feldman et al., 2021) and is currently $2019.
Within the ATB Data spreadsheet, costs are separated into energy and power cost estimates, which allows capital costs to be constructed for durations other than 4 hours according to the following equation:
Total System Cost ($/kW) = (Battery Pack Cost ($/kWh) × Storage Duration (hr) + Battery Power Capacity (kW) × BOS Cost ($/kW) + Battery Power Constant ($)) / Battery Power Capacity (kW)
For more information on the power versus energy cost breakdown, see (Cole and Frazier, 2020).
Future Projections: Future projections are based on the same literature review data that informs (Cole and Frazier, 2020), which generally used the median of published cost estimates to develop a Mid Technology Cost Scenario and the minimum values to develop a Low Technology Cost Scenario. However, as the battery pack cost is anticipated to fall more quickly than the other cost components (which is similar to the recent history of PV system costs), the battery pack cost reduction is taken from (Bloomberg New Energy Finance (BNEF), 2019b)(Frith, 2020) and reduced more quickly. This tends to make the longer-duration batteries (e.g., 8 hours) decrease more quickly while short duration (e.g., 2 hours) decreases less quickly into the future. All durations trend toward a common trajectory as battery pack costs decrease into the future.
Operation and Maintenance (O&M) Costs
Base Year: (Cole and Frazier, 2020) assume no variable O&M (VOM) cost. All operating costs are instead represented using fixed O&M (FOM) costs. They include augmentation costs needed to keep the battery system operating at rated capacity for its lifetime. In the 2020 ATB, FOM is defined as the value needed to compensate for degradation to enable the battery system to have a constant capacity throughout its life. According to the literature review (Cole and Frazier, 2020), FOM costs are estimated at 2.5% of the capital costs in dollars per kilowatt.
Future Years: In the 2021 ATB, the FOM costs and VOM costs remain constant at the values listed above for all scenarios.
Capacity Factor
The cost and performance of the battery systems are based on an assumption of approximately one cycle per day. Therefore, a 4-hour device has an expected capacity factor of 16.7% (4/24 = 0.167), and a 2-hour device has an expected capacity factor of 8.3% (2/24 = 0.083). Degradation is a function of this usage rate of the model and systems might need to be replaced at some point during the analysis period. We use the capacity factor for a 4-hour device as the default value for ATB.
Round-Trip Efficiency
Round-trip efficiency is the ratio of useful energy output to useful energy input. (Mongird et al., 2020) identified 86% as a representative round-trip efficiency, and the 2021 ATB adopts this value.
References
The following references are specific to this page; for all references in this ATB, see References.