Land-Based Wind
2021 ATB data for land-based wind are shown above. These projections use bottom-up engineering models in combination with defined 2030 turbine and plant technologies. The future technology pathways are based on predicted technology advancements from continued and rapid scaling of modern wind turbine nameplate ratings and increased rotor sizes. These gains in turbine scaling and technology advancements enable economies of scale, balance-of-plant efficiencies, and more-efficient energy extraction for turbines in various resource regimes at greater heights above the ground.
The following chart shows the LCOE scenario results presented above normalized for a comparison with literature projections.
In general, there is substantial focus throughout the global wind industry on driving down costs and increasing performance as a result of fierce competition from within as well as among several power generation technologies, including solar PV and natural gas-fired generation.
The three scenarios for technology innovation are:
- Conservative Technology Innovation Scenario (Conservative Scenario): wind technology scale increasing in the near term but leveling off soon afterward, with limited advancement in turbine controls and science-based modeling to inform the next generation of wind technology
- Moderate Technology Innovation Scenario (Moderate Scenario): scale continuing to increase rapidly with innovations overcoming transportation challenges; advancements occurring in turbine controls; science-based modeling informing the next generation of wind technology
- Advanced Technology Innovation Scenario (Advanced Scenario): enabling large-scale increases in turbine technology size and scope, new transportation solutions, fully integrated wind plant advanced control systems, and high-fidelity science-based modeling to inform multiple aspects of turbine design.
Resource Categorization
In the 2021 ATB, the cost and performance data for wind technologies are specified for different resource categories that are consistent with those used to represent the full wind resource in the NLR Regional Energy Deployment System (ReEDS) model (Brown et al., 2020). In ATB editions before 2020, these classes were referred to as techno-resource groups (TRGs) and they were designed based on site-specific levelized cost of energy by considering, in combination, the wind resource quality (e.g., wind speed) and turbine configuration (e.g., specific power). The TRG methodology is described in Appendix H of the Wind Vision study (U.S. Department of Energy, 2015). Starting with the 2020 ATB, the TRG-based classification was replaced with a simpler set of resource "wind speed classes" that are defined based on only annual mean wind speed.
For land-based wind, each of the potential wind sites represented in the ReEDS model is associated with one of 10 wind speed classes. The range of annual mean wind speeds, averaged for all years between 2007 and 2013, ranges from 1.72 m/s to 12.89 m/s. To identify the break points that define the 10 wind speed classes within this wind speed range, we specify the percentile of the total wind resource technical potential in capacity terms associated with each class. For example, the top wind speed class (Wind Speed Class 1) is defined based on the mean wind speed range of the top 1% of all potential wind capacity in the contiguous United States. We specify a narrower percentile range for the top classes so that ReEDS has higher-resolution representation for the best sites.
The following table shows the percentile ranges assumed for each resource class as well as the resulting mean wind speed ranges that define each class. We apply these percentiles to a representation of the wind resource using only the most basic exclusions referred to as the "open access" scenario (Lopez et al., 2021) and based on analysis from the Renewable Energy Potential (reV) model (Maclaurin et al., 2019). Although the ReEDS model and other analyses can and do rely on different resource representations with different exclusion assumptions, the same mean wind speed break points are used for the 10 wind speed classes shown in the table.
The average wind speed varies from project to project across the United States. Wind Speed Class 4 is indicative of a moderate-quality wind regime and is intended to be a representative wind resource for a majority of wind projects installed in the United States. Wind Speed Class 1 is suggestive of a resource-rich wind resource that is most attractive for wind project development, and Wind Speed Class 10 represents a less favorable wind resource site.
| Wind Speed Class | Min. Wind Speed (m/s) | Max. Wind Speed (m/s) | Wind Speed Range (m/s) | Percentile Range |
|---|---|---|---|---|
| 1 | 9.01 | 12.89 | 3.88 | <1% |
| 2 | 8.77 | 9.01 | 0.24 | 1%–2% |
| 3 | 8.57 | 8.77 | 0.2 | 2%–4% |
| 4 | 8.35 | 8.57 | 0.22 | 4%–8% |
| 5 | 8.07 | 8.35 | 0.28 | 8%–16% |
| 6 | 7.62 | 8.07 | 0.45 | 16%–32% |
| 7 | 7.1 | 7.62 | 0.52 | 32%–48% |
| 8 | 6.53 | 7.1 | 0.57 | 48%–64% |
| 9 | 5.9 | 6.53 | 0.63 | 64%–80% |
| 10 | 1.72 | 5.9 | 4.18 | 80%–100% |
Notes:
- Values reported in table are for wind speeds 110 meters above the ground.
Scenario Descriptions
| Scenario | Rotor, Nacelle Assembly | Tower | Science-Based |
|---|---|---|---|
| Conservative Scenario | Technology Description: Nacelles and monolithic blades are transported by truck, scaling is limited due to road infrastructure, nacelles and blades are similar in size to current wind turbine characteristics. Justification: Current wind turbine blades are fabricated as a single piece and are typically transported from the manufacturer to the project site by truck or rail, which means that without introducing new innovations (e.g., blade segmentation), they are limited by the infrastructure constraints on the transportation route (e.g., overhead bridge heights and tunnel openings). | Technology Description: Steel towers are transportable, road limitations are similar to current ones, and hub heights are not much greater than current market average hub heights of 90 meters (m) (Stehly et al., 2020). Justification: Turbine tower fabricators currently manufacture canned steel tower sections transported by Schnabel trailers that are constrained by overhead bridge clearances. In the United States, this constrains the base diameter of the steel towers to about 4.3 meters (m) (Cotrell et al., 2014). | Technology Description: The scenario is limited to no integration of high-fidelity modeling or advanced controls, and plant optimization does not change. Justification: Legacy wind turbine and plant control strategies remain in place, limiting introduction of new lightweight turbine designs and turbine wake loss impacts. |
| Moderate Scenario | Technology Description: Advancements in blade engineering allow large, segmented blades to be transported by truck, thus enabling larger rotors. Justification: Various engineering firms have developed modular blade systems such as the Nabrajoint (see Nabrawind Technologies), which uses a bolted connection between blade modules that can be transported individually and assembled on-site, eliminating the logistics barriers for blade lengths over 70 m; the first full-scale joint in a real blade segment is already manufactured and has been tested to demonstrate strength under operative loads. | Technology Description: Segmentation of the lower tower enables large-diameter towers, increased hub heights, and larger turbines Justification: Several advanced steel construction and concrete/steel hybrid tower designs from various design and manufacturing firms are available on the market, enabling cost-effective taller towers exceeding 140 m. One example of an advanced steel construction designed tower is the large-diameter steel tower (LDST) launched by Vestas in 2014. The LDST technology enables taller towers by allowing the bottom section of a tower to be segmented into three sections and transported on a flatbed truck and then reassembled on-site using vertical flanges; the technology is now used worldwide to take advantage of stronger wind conditions at higher hub heights (Vestas Wind Systems A/S, 2014). | Technology Description: Increased integration of high-fidelity modeling and advanced controls enables lower CAPEX and higher capacity factors. Justification: Widespread application of advanced wind plant prognostic systems by several wind turbine original equipment manufacturers and wind plant asset owners and operators that collect and analyze data at the turbine, plant, and fleet levels to optimize operations and maintenance (O&M) planning and increase annual energy production. One example of this is General Electric's digital wind plant solutions for land-based wind applications through their cloud-based software (Predix), which has shown a 16% increase annual energy production (see "Digital Solutions for Wind Farms"). |
| Advanced Scenario | Technology Description: Larger nameplate turbines with segmented blades or partial pitch rotors are transported by truck or rail, which enables significantly larger blades. There is increased adoption of active aerodynamic controls and partial pitch blades. Justification: Current research such as the Big Adaptive Rotor (BAR) project is investigating various rotor configuration, including two-bladed, downwind, and partial pitch technologies. And current research is also investigating transportation options for large blades (e.g., airship). BAR is also investigating the potential of active aerodynamic surfaces and controls for system load reduction (Johnson et al., 2019). Also, Envision has tested a two-bladed partial pitch prototype. | Technology Description: On-site manufacturing of advanced steel tower (spiral welding) or hybrid tower systems removes transportation limits to tower size, thus enabling much greater hub heights and optimized tower base diameters. Justification: The ability to enable onsite fabrication of continuous spiral-welded towers to be optimized to system requirements without needing to constrain the tower base has been demonstrated by Keystone Tower Systems, which has also designed optimal high hub-height towers up to 180 m (see Keystone Tower Systems). Other advanced hybrid tower systems (e.g., concrete and steel) have also been demonstrated, and may become more widely deployed for larger wind energy systems (see "Highest Performance: Using Wind Energy Efficiently," Max Bögl Wind AG). | Technology Description: All levels of high-fidelity modeling and advanced controls are achieved. Justification: Wind industry and national laboratory research and development programs are focused on enabling advanced high-fidelity modeling to capture rotor wake dynamics and full resolution of rotating blades, assessment of wake development properties from dynamic wind plant control strategies (e.g., yaw, thrust, and tilt), and evaluation of wind plant controls that elevate high system loads and impact system design. The industry continues to better understand atmospheric sciences and forecasting, novel sensing technologies and measurement techniques, computer and computational sciences, multiscale and multidisciplinary computational models, digitalization, big data, and information/data science. (Dykes et al., 2019). |
| Impacts by Technology Innovation |
|
|
|
| References for all Scenarios |
|
|
|
In general, differences among the technology cost cases reflect different levels of adoption of innovations. Reductions in technology costs reflect the following cost reduction opportunities:
- Continued turbine scaling to higher-megawatt turbines with larger rotors such that the megawatt capacity/swept area decreases, resulting in higher capacity factors for a given location
- Continued diversification of turbine technology whereby the largest rotor diameter turbines tend to be located in lower wind speed sites, but the number of turbine options for higher wind speed sites increases
- Introduction of segmented blades allows for a common blade base to be married to a number of segmented blade tips, aiding in reducing blade production costs.
- Taller towers that result in higher capacity factors for a given site that are due to the wind speed increase with elevation above ground level
- Improved plant siting and operation to reduce plant-level energy losses, resulting in higher capacity factors
- Wind turbine technology and plants that are increasingly tailored to and optimized for local site-specific conditions
- More-efficient O&M procedures combined with more reliable components to reduce annual average fixed operation and maintenance (FOM) costs
- Continued manufacturing and design efficiencies such that the capital cost per kilowatt decreases with larger turbine components
- Adoption of a wide range of innovative control, design, and material concepts that facilitate the above high-level trends.
Representative Technology
To obtain current and future cost and performance estimates, the technology representations for the Base Year (2019) and 2030 are defined. The representative technology for land-based wind in the Base Year consists of a 2.6-MW nameplate rating, a rotor diameter of 121 m, and a hub height of 90 m (Wiser et al., 2020). The representative technology for 2030, in the Moderate Scenario, assumes a 5.5-MW turbine with a rotor diameter of 175 m and a hub height of 120 m. Notably, turbines that are nearly of this scale are commercially available today and are expected to be installed at select sites in the United States in the 2020s. See below for details on changes to parameters in ATB projections.
Methodology
This section describes the methodology to estimate current and future CAPEX, O&M, and capacity factor. The current and future cost and performance estimates assume a 200-MW wind plant, which is consistent with current project sizes (Wiser et al., 2020). For standardized assumptions, see labor cost, regional cost variation, materials cost index, scale of industry, policies and regulations, and inflation.
Capital Expenditures (CAPEX)
Definition: Wind plant capital expenditures are defined to include items noted in the components of CAPEX table below.
Base Year: Capital expenditures (CAPEX) associated with wind plants installed in the interior of the country are used to characterize CAPEX for hypothetical wind plants with average annual wind speeds that correspond with the median conditions for land-based wind projects installed in 2019 (Stehly et al., 2020). The following chart shows historical CAPEX for land-based wind.
Future Years: To reduce the vast number of combinations of future pathways, NLR analysts define three future turbine configuration in 2030 to estimate cost and performance for the Conservative, Moderate, and Advanced Scenarios. The specific 2030 turbine configuration for the Moderate Scenario assumes a nameplate capacity of 5.5 MW and a rotor with a diameter of 175 m that is placed on a 120-m tower.
The defined turbine characteristics are used to estimate the total system CAPEX of a theoretical commercial scale (e.g., 200-MW) project. In the 2021 ATB, this site-specific design optimization process, which is often reflected in different CAPEX values across wind speed classes, is simplified. The CAPEX estimates for the Base Year (2019) is the same across the 10 wind speed classes. In 2030, the CAPEX changes for each of the scenarios (i.e., Conservative, Moderate, and Advanced) since each scenario assumes a different turbine technology. However, the CAPEX within each scenario does not change across the 10 wind speed classes. The relatively low observed sensitivity to significantly different turbine configurations for a single reference site indicates uncertainty and a need for wind turbine tailoring for varied site conditions. It is generally expected that over the long term wind turbine designs will be optimized for project specific site conditions. In the ATB, CAPEX reflects typical plants and does not include differences in regional costs associated with labor, materials, taxes, or system requirements. The related Standard Scenarios product uses regional CAPEX adjustments. The range of CAPEX demonstrates variation with wind resource in the contiguous United States.
Use the following table to view the components of CAPEX, and how they change with the scenarios.
Operation and Maintenance (O&M) Costs
Definition: Operation and maintenance (O&M) costs represent the all-in fixed and variable expenditures required to operate and maintain a wind plant, including items noted in the components of O&M table below. For land-based wind, the all-in O&M expenditures is reported in FOM.
Base Year: The all-in O&M of $43/kW-yr in the Base Year is estimated from Assessing Wind Power Operating Costs in the United States: Results from a Survey of Wind Industry Experts (Wiser et al., 2019) and is also reported in the 2019 Cost of Wind Energy Review (Stehly et al., 2020). No variation of FOM with wind speed class (or wind speed) is assumed. The following chart shows all-in O&M expenditures based on wind plant commissioning date.
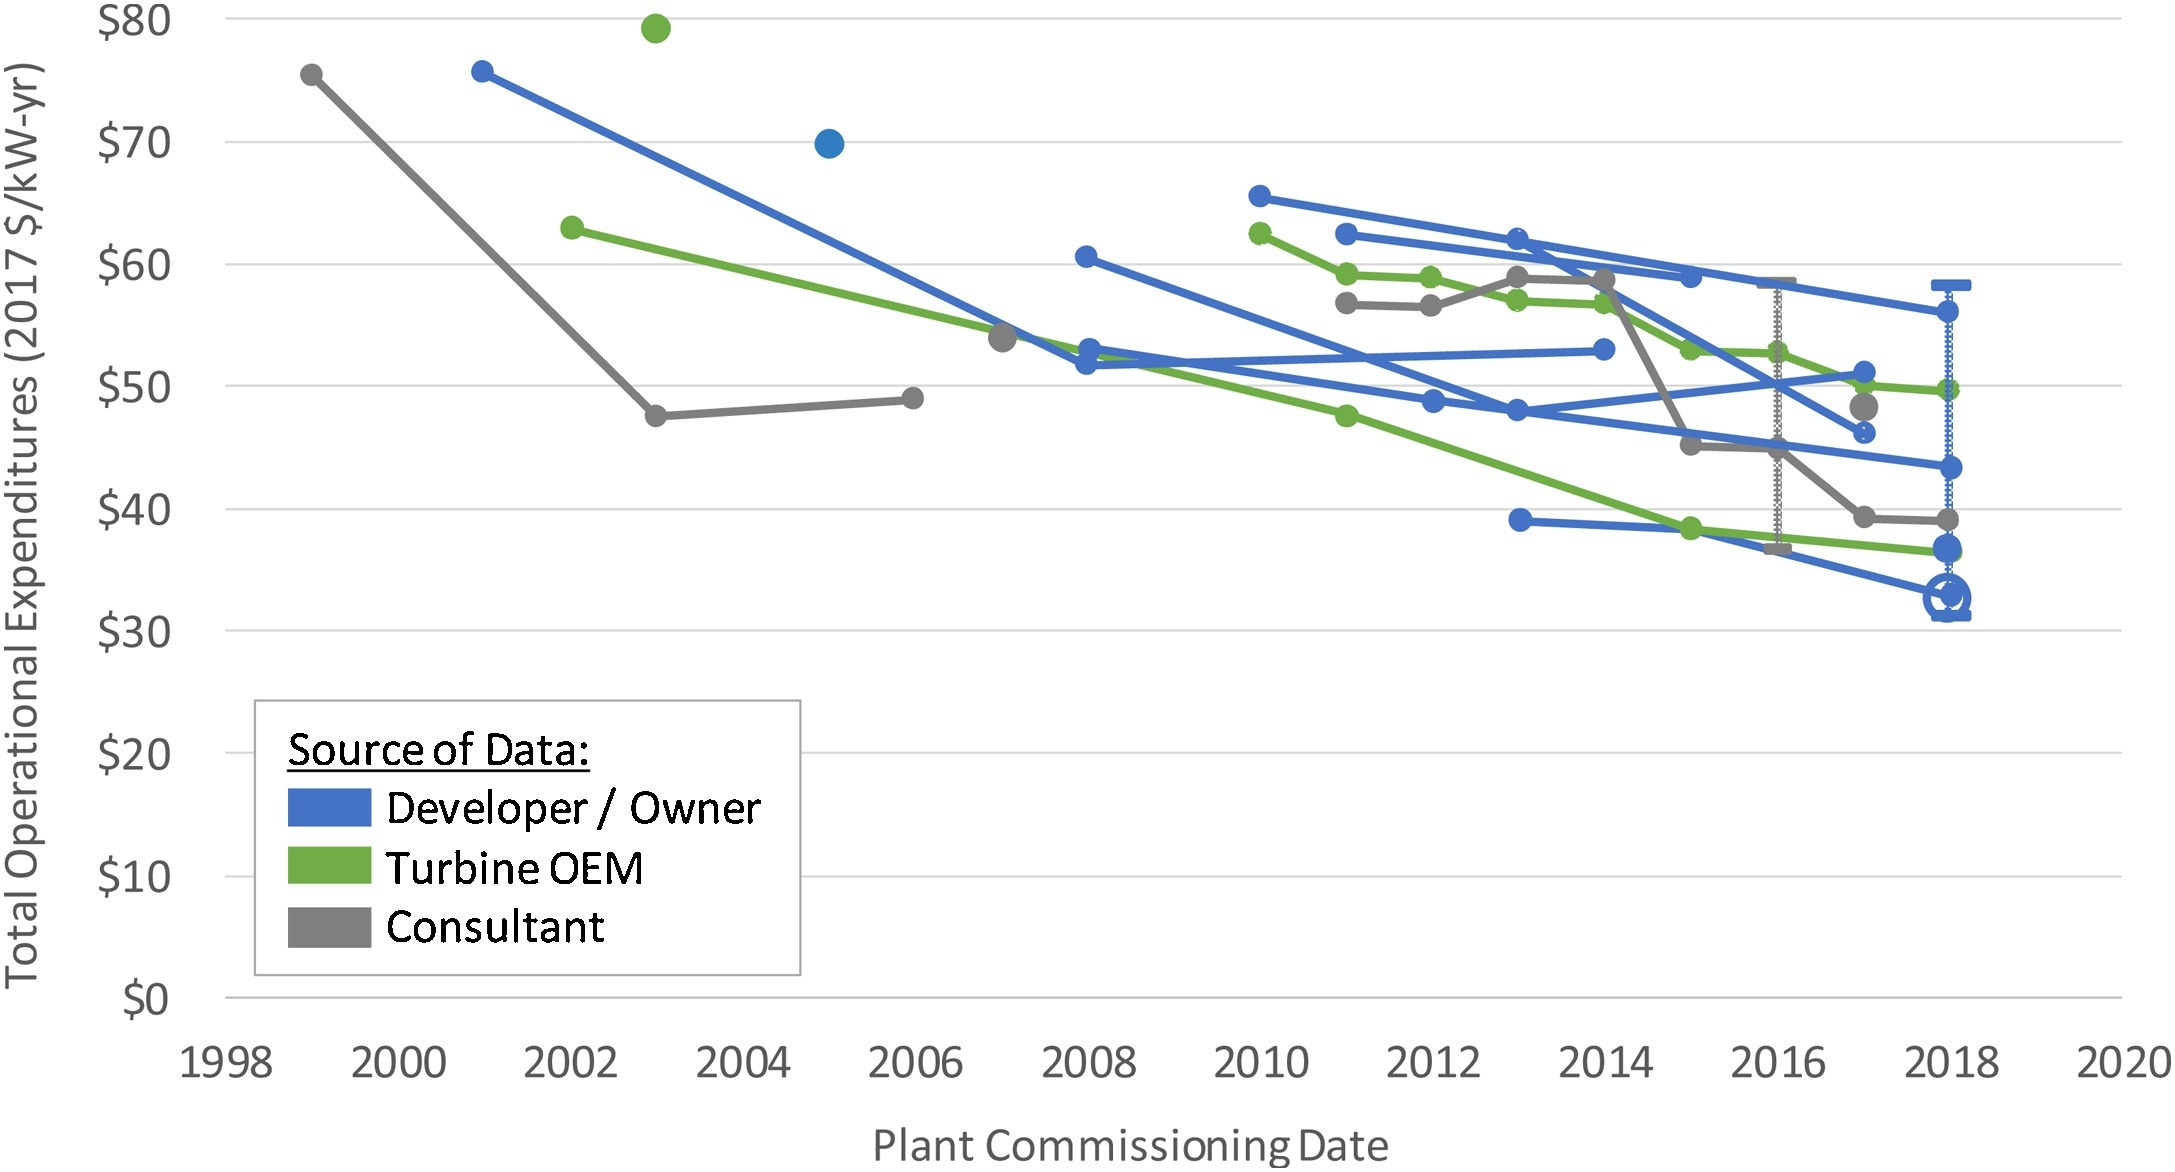
Source: (Wiser et al., 2019)
Future Years: Future FOM is assumed to decline by approximately 10% by 2030 in the Moderate Scenario and 20% in the Advanced Scenario. These values are informed by recent benchmarking work for wind power operating costs in the United States (Wiser et al., 2019). The ATB does not consider differences in regional FOM costs associated with labor, materials or differences in O&M strategies—for example, operating the wind plant to maximize tax credits by deferring maintenance activities.
Use the following table to view the components of O&M.
Capacity Factor
Definition: The capacity factor is influenced by the wind plant's generation profile, expected downtime, and energy losses within the wind plant. The specific power (i.e., ratio of machine rating to rotor swept area) and hub height are design choices that influence the capacity factor.
Base Year: Most installed U.S. wind plants generally align with ATB estimates for performance in Wind Speed Classes 2–7. High wind resource sites associated with Wind Speed Class 1 as well as very low wind resource sites associated with Wind Speed Classes 8–10 are not as common in the historical data, but the range of observed data encompasses ATB estimates.
The following chart shows a range of capacity factors based on variation in the resource for wind plants in the contiguous United States and the future capacity factor estimates for the Conservative, Moderate, and Advanced Scenarios. Future projections are shown for the Conservative, Moderate, and Advanced Scenarios.
To calculate the Base Year and future capacity factors, the 2019 and 2030 turbine characteristics defined in the Representative Technology section are input into the System Advisor Model (SAM) to develop an idealized power curve, and SAM is run for each of the weighted average wind speeds in each wind speed class. The capacity factors are calculated at the representative turbine hub height by extrapolating the wind speed up or down from the referenced 110-m, above-ground-level, long-term average hourly wind resource data from the Wind Integration National Dataset (WIND) Toolkit.
Future Years: Technology innovations that enable higher hub heights and increase wind plant energy capture through advanced controls are expected to increase capacity factor for all wind speed classes (Dykes et al., 2017). Turbine rotor diameter, specific power, and hub height can each be traded-off to achieve a given capacity factor, depending on site conditions and costs for pursuing one approach or the other; plant layout and operational strategies that impact losses are additional levers that may be used to achieve a given capacity factor. The 2021 ATB presents one of many capacity factor improvement pathways for LCOE reduction.
References
The following references are specific to this page; for all references in this ATB, see References.