Blendstock for Oxygenate Blending (BOB)
Detailed information about the blendstock for oxygenate blending (BOB) is presented below.
| Fuel Name | Reformulated BOB | Conventional BOB |
|---|---|---|
| Fuel Pathway | Reformulated BOB | Conventional BOB |
| Scenario | Current Market | Current Market |
| Plant Gate Fuel Price ($/gge) | 2.01 | 1.69 |
| CO2e Emissions (Well to Tank) (g/mmBtu) | 99,500 | 21,400 |
| NOX Emissions (Well to Tank) (g/mmBtu) | 26.80 | 17.40 |
| SOX Emissions (Well to Tank) (g/mmBtu) | 71.70 | 32.20 |
| PM Emissions (Well to Tank) (g/mmBtu) | 6.85 | 4.68 |
| CO2e Emissions (Well to Wheels) (g/mmBtu) | 19,500 | 101,000 |
| NOX Emissions (Well to Wheels) (g/mmBtu) | 26.30 | 17.90 |
| SOX Emissions (Well to Wheels) (g/mmBtu) | 43.80 | 60.10 |
| PM Emissions (Well to Wheels) (g/mmBtu) | 6.75 | 4.77 |
Key Assumptions
The data and estimates presented here are based on the following key assumptions:
- The fuel price (e.g., Lowest Cost, Lowest Emissions) is associated with a single year. Because we do not provide a time-series trajectory, here we show fuel price at a frozen level for all years so we can offer a range of fuel price values. In the levelized cost of driving and emissions charts, this approach clearly distinguishes effects of fuels from those of vehicle technologies, because fuels remain constant while vehicle technologies change over time.
- The plant gate fuel prices shown here are meant to reflect minimum fuel selling prices (and do not include distribution costs or taxes).
- BOB prices are estimated to allow final fuel price calculations at different blending levels. The fuel prices shown here are meant to reflect wholesale fuel prices (and do not include distribution costs or taxes).
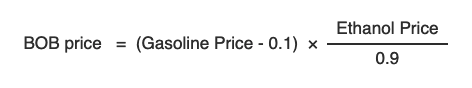
- The BOB prices are estimated from 2018 average retail conventional and reformulated gasoline prices across all grades from the U.S. Energy Information Administration (EIA, 2020)and from the 2018 wholesale ethanol prices and 2018 Components of Selected Petroleum Product Prices from the Reference case in the Annual Energy Outlook 2019 (EIA, 2019).We estimate the wholesale gasoline price by subtracting the 2019 distribution and taxes ($0.43/gal for distribution and $0.54/gal for taxes and fees) for motor gasoline from Annual Energy Outlook 2019 from the retail gasoline price, resulting in a $1.69/gal wholesale price for conventional gasoline and a $1.93/gal wholesale price for reformulated gasoline. The BOB price is calculated assuming gasoline is blended with 10% starch ethanol by volume (at a wholesale price of $1.53/gal) using the following equation:
- The prices are then converted from dollars per gallon to dollars per gasoline gallon equivalent using the lower heating values of gasoline (112,194 Btu/gal) and gasoline blendstock (116,090 Btu/gal) from GREET 2018 (Argonne National Laboratory, 2018).
- The emissions intensities are from GREET and are estimated from gasoline pathways assuming no ethanol is used for blending. Conventional BOB corresponds to "gasoline blendstock," and the reformulated BOB corresponds to "CA gasoline blendstock" in the GREET model.
- The data downloads include additional detail on assumptions and calculations for each metric.
Definitions
For detailed definitions, see:
Blendstock for Oxygenate Blending (BOB)
References
The following references are specific to this page; for all references in this ATB, see References.
Argonne National Laboratory. GREET Model: The Greenhouse Gases, Regulated Emissions, and Energy Use in Transportation Model. Argonne, IL (United States): Argonne National Laboratory, 2018. https://greet.es.anl.gov/.
EIA. “Annual Energy Outlook 2019.” Washington, D.C.: U.S. Energy Information Administration, 2019. https://www.eia.gov/outlooks/aeo/.
EIA. “U.S. Gasoline and Diesel Retail Prices,” July 13, 2020. https://www.eia.gov/dnav/pet/pet_pri_gnd_dcus_nus_a.htm.