Definitions
Definitions of common terms in the 2020 Transportation ATB are presented below.
Vehicles
Battery electric vehicles (BEVs) use a battery pack to store the electrical energy that powers the motor. The batteries are charged by plugging the vehicle into an electric power source (DOE, 2019).
For additional background, see the Alternative Fuels Data Center's All-Electric Vehicles.
The battery cost assumptions used in the Annual Technology Baseline vehicle cost trajectories are shown below and are presented at the battery pack level. The ATB Mid trajectory corresponds with the Base performance, Low technology progress case in Islam et al. (Islam et al., 2020), which reaches around $120/kilowatt-hour in 2050. The ATB Advanced trajectory follows the Base performance, High technology progress case from Islam et al. (Islam et al., 2020)which reaches around $80/kilowatt-hour in 2050, consistent with goals from the Vehicle Technologies Office (Boyd, 2018). The ATB Constant trajectory is held constant at the 2020 value for ATB Mid. Costs are shown are for usable energy.
Note that estimates used in the ATB Advanced trajectory are higher than some recent battery cost estimates from other references (Lutsey and Nicholas, 2019); (Kah, 2019); (BloombergNEF, 2019). Some variations may be attributed to differences in the level of reporting; the Transportation ATB presents battery costs for usable energy at the pack level ($/kWh estimates based on usable energy are higher than estimates based on total energy). The cost estimates are consistent with the U.S. Department of Energy Vehicle Technologies Office.
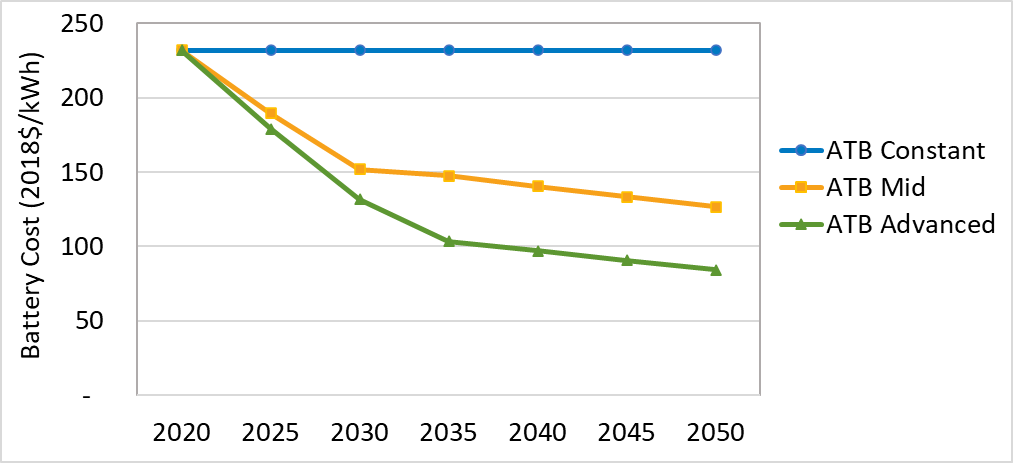
Sources: Islam et al. (Islam et al., 2020). Costs differ from original source due to conversion to 2018 dollars.
See the Diesel Internal Combustion Engine Vehicle page.
See the Gasoline Hybrid Electric Vehicle page.
See the Gasoline Internal Combustion Engine Vehicle page.
See the Natural Gas Internal Combustion Engine Vehicle page.
Plug-in hybrid electric vehicles (PHEVs) use both an electric motor and an internal combustion engine. Batteries power the motor and gasoline, diesel, or another fuel powers the engine or other propulsion source. Operating costs and fuel use are lower than those for conventional vehicles because electricity from the grid is less expensive and electric motors are very efficient. Emissions from PHEVs may also be lower, depending on the electricity source (DOE, 2019).
For additional background, see the Alternative Fuels Data Center's Plug-In Hybrid Electric Vehicles.
Fuel cell electric vehicles (FCEVs) use fuel cells for energy conversion, which are more efficient than internal combustion engines. The use hydrogen as the power source and emit water vapor and warm air, with no other tailpipe emissions. FCEVs and the supporting hydrogen fueling infrastructure are in an early deployment stage (DOE, 2019).
For additional background, see the Alternative Fuels Data Center's Fuel Cell Electric Vehicles.
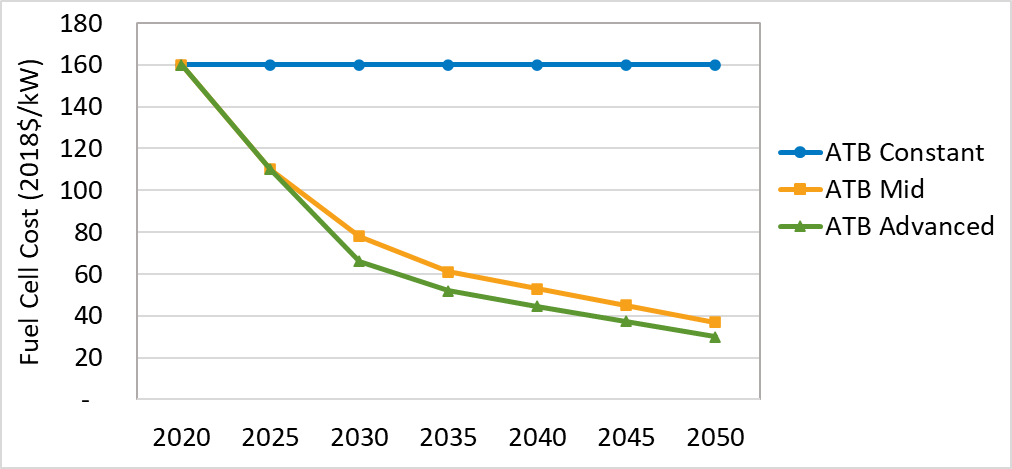
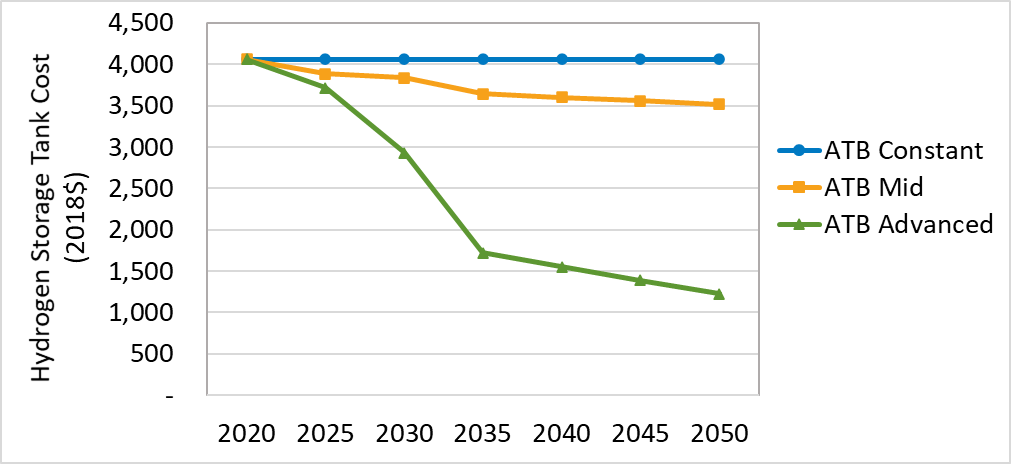
The fuel cell and hydrogen storage cost assumptions used in the Transportation ATB vehicle cost trajectories are shown below. Estimates of fuel cell costs and hydrogen storage vessel costs were based on an assumption of low-volume manufacturing today that gradually increases to high production volume manufacturing by 2050. These costs were adapted from James et al. (James et al., 2018) and Adams, et al. (Adams et al., 2019). The estimates were input into the Autonomie model, with other vehicle component assumptions (e.g. lightweighting and aerodynamic improvements over time) consistent with Islam et al. (Islam et al., 2020). The ATB Mid trajectory corresponds to the Base performance, Low technology progress case. The ATB Advanced trajectory corresponds to the Base performance, High technology progress case. The ATB Constant trajectory is set to the 2020 values in the low-technology case and held constant through 2050. The final fuel cell and hydrogen storage costs for a vehicle depends on the size of the fuel cell stack and storage tank, which vary depending on the technology progress of the other components and vehicle size as well as the resulting fuel economy.
Fuels
Alternative jet fuel, also called "biojet" or aviation biofuel, is derived from biomass. Up to specified blending limits that vary by pathway, it can be used directly in airplanes that use regular, petroleum-based aviation fuel (DOE, 2019).
Biodiesel is a renewable and biodegradable fuel that is manufactured from vegetable oils, animal fats, or recycled restaurant grease (DOE, 2019). For additional background, see the Alternative Fuels Data Center's Biodiesel Fuel Basics.
Conventional BOB (CBOB) consists of liquid hydrocarbon components intended for blending with oxygenates to produce finished conventional motor gasoline (EIA, 2019a).
Reformulated BOB (RBOB) consists of liquid hydrocarbon components intended for blending with oxygenates to produce finished reformulated motor gasoline (EIA, 2019a).
See the Blendstock for Oxygenate Blending page.
Conventional E10 is a low-level blend composed of 10% ethanol and 90% gasoline (DOE, 2019).
For additional information, see the U.S. Energy Information Administration's Gasoline Explained.
Conventional E15 is a blend consisting of 10.5% to 15% ethanol and gasoline (DOE, 2019). The Transportation ATB assumes ethanol content of 15%.
Conventional jet fuel is refined from petroleum. This product fuels jet aircraft engines, and may consist of either kerosene-type jet fuel or naphtha-type jet fuel (EIA, 2019b).
Conventional low-sulfur diesel is a fuel and a product of petroleum refining that consists of distillates or blends of distillates with residual oil used in motor vehicles (EIA, 2019b).
For additional information, see the U.S. Energy Information Administration's Diesel Fuel Explained.
Conventional marine diesel is fuel supplied to ships. It consists primarily of residual and distillate fuel oil (EIA, 2019b).
See the Electricity page.
See the Ethanol page.
High-blend ethanol fuel contains 51% to 83% ethanol. The blend level of ethanol is selected based on air quality regulations and depends on location and season. This blend level is used in flexible-fuel vehicles (DOE, 2019).
See the Hydrogen page.
See the Natural Gas page.
Reformulated gasoline is burns more cleanly than conventional gasoline and reduces smog-forming and toxic pollutants because it is blended to meet air quality regulations (EPA, 2015b). E10 contains 10% ethanol and 90% gasoline (DOE, 2019).
Reformulated gasoline is a gasoline blend that results in lower emissions of nitrogen oxides (NOX; see NOX emissions), volatile organic compounds, and toxic pollutants than conventional gasoline when burned (EPA: "Gasoline Standards: Reformulated Gasoline"). Conventional E15 is a low-level blend composed of 10.5% to 15% ethanol and gasoline (DOE, 2019). The Transportation ATB assumes ethanol content of 15%.
Renewable diesel is a transportation fuel for use in diesel engines that is derived from biomass. It is also called "green" diesel (DOE, 2019).
Scenarios
Vehicle Scenarios
Vehicle scenarios in the Transportation ATB incorporate assumptions on both the level of technology advancement achieved in each powertrain (e.g., lightweighting, engine efficiency) and the projected costs for the assumed technologies through 2050. Assumptions for assigning values in the Advanced and Mid trajectories reflect lab analyst judgement. Given the rapid pace of technology improvement and market advancement the assumptions here may not reflect the most recent trends. Data will be updated on an annual basis to reflect updated cost and performance trajectories as they become available.
In the Advanced trajectory, technology advances occur with breakthroughs, increased public and private R&D investment, and other market conditions that lead to significantly improved cost and performance levels but do not necessarily reach the full technical potential. Vehicle technologies advance substantially and achieve high performance, low cost, or both. Attaining this level of cost improvement is assumed to be very uncertain.
In the Mid trajectory, technology cost and performance improve at moderate levels, with continued industry growth and R&D investment (both public and private). Vehicles include moderate technology advancements (in between the currently manufactured technology and the Advanced trajectory) to achieve higher performance, lower costs, or both, and attaining this level of cost improvement is assumed to be moderately uncertain.
In the Constant trajectory, technology cost and performance from the base year are shown through 2050, without further advancement in R&D or markets. This cost level is extended through 2050 for reference only; it does not imply that frozen costs and performance are anticipated.
Technology advances include changes that may reduce costs or may increase costs while improving performance, which implies that costs do not always decline between less-advanced and more-advanced scenarios. However, while technology advancements that improve performance may increase vehicle cost, they may also result in a lower levelized cost of driving due to potential fuel savings.
Fuel Scenarios
In the Current Market scenario, fuel price and emissions data are shown for fuels that are commercially available, with exact source, timing, averaging, and other details described in the references. Fuel metrics are primarily based on data from the U.S. Energy Information Administration. Fuel price may differ from retail prices because of market volatility and local market conditions. See specific notes and references on the fuels pages for specific dates and averaging methods.
In this scenario, fuel metrics are based on techno-economic modeling of the current technology at current market production volume as specified in the notes and references on the fuels pages.
In this scenario, fuel metrics are based on techno-economic modeling of the current technology at high market production volume. Timing of this scenario depends on when high production volume is achieved.
In this scenario, fuel metrics are based on a future technological state modeled at low market production volume, as might be the case for a pioneer plant.
In this scenario, fuel metrics are based on a future technological state, based on engineering-economic modeling at high market production volume, often called "nth plant." Timing of this scenario depends on when high production volume is achieved.
Select subsets of fuels are shown on the vehicle charts for the Transportation ATB, and include the Baseline, Lowest Cost, and Lowest CO2e Emissions fuel pathways:
Baseline fuels are meant to best represent current fuels available for each powertrain today. Due to the variability of current hydrogen prices, current modeled costs are used as the Baseline fuel instead of current market costs for hydrogen for fuel cell electric vehicles.
The Lowest Cost and Lowest Co2e Emissions fuels correspond to the fuel pathways with lowest cost and lowest CO2e emissions, respectively, that are included in the ATB for each powertrain.
The fuel pathways used for each powertrain for each fuel subset are shown in the table below. While the charts on the Transportation ATB only include these select fuels, the full set of fuels can be downloaded and explored.
| Powertrain | Baseline Fuel Pathway | Lowest Cost Fuel Pathway | Lowest CO2e Emissions Fuel Pathway |
|---|---|---|---|
| Gasoline internal combustion engine vehicle, hybrid electric vehicle, charge-sustaining plug-in hybrid electric vehicle | Conventional gasoline (E10) with starch ethanol | Conventional gasoline (E10) with starch ethanol | Reformulated E15 gasoline with cellulosic thermochemical ethanol |
| Diesel internal combustion engine vehicle | Conventional low-sulfur diesel | Conventional low-sulfur diesel (2050 low price) | Biofuel (diesel) |
| Compressed natural gas internal combustion engine vehicle | Natural gas | Natural gas | Natural gas |
| BEV, charge-depleting plug-in hybrid electric vehicle | Plug-in electric vehicle charging electricity,national grid mix | Plug-in electric vehicle charging electricity, future low renewable energy penetration grid mix | Plug-in electric vehicle charging electricity, future high renewable energy penetration grid mix |
| Fuel cell electric vehicle | Steam methane reforming (Current Modeled, Current Volume) | Steam methane reforming (Future Modeled, High Volume) | Low-temperature electrolysis (Future Modeled, High Volume) |
Metrics
All cost are converted to 2018 dollars using the gross domestic product implicit price deflator (FRED, 2019).
For the purposes of the Transportation ATB, fuel economy is tank-to-wheels fuel economy, reported in miles per gallon gasoline equivalent, and it represents how efficiently a vehicle converts fuel during operation (Elgowainy et al., 2016). Fuel economy values represent adjusted real-world, on-road estimates, based on 55% city (Urban Dynamometer Driving Schedule cycle) and 45% highway (Highway Fuel Economy Test cycle) driving for all vehicle powertrains.
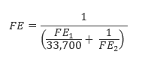
For plug-in hybrid electric vehicles, the fuel economy is the combined utility-factor-weighted fuel economy averaged across charging-depleting and charge-sustaining modes. This is consistent with the results provided in Islam et al. (Islam et al., 2020). (The breakout of utility weighted average electricity and liquid fuel economy for plug-in hybrid electric vehicles is included the downloadable data.) The combined utility-factor-weighted fuel economy is calculated using the equation below, where FE1 is the utility weighted charge-depleting fuel economy (in Wh/mi) and FE2 is the utility-factor-weighted charge-sustaining fuel economy (in mppge). We convert Wh to gge using the assumption that 1 gge = 33,700 watt-hours (EPA, 2011).
The levelized cost of driving (LCOD) is an indicator of the cost of operating a vehicle over its lifetime on a per-mile basis. As calculated in the Transportation ATB, it includes initial costs for the vehicle, fuel costs, and, if applicable, residential charger equipment and installation. It does not include other operations or maintenance costs beyond fuel, or insurance. The calculation used here assumes a single owner over the life of the vehicles, and depreciation and resale value are not included. Note that the changes over time are attributable only to vehicle technology changes; fuel costs are held constant at the cost for the selected fuel.
For light-duty vehicles:
- The LCOD represents the cost per mile of driving a vehicle.
- The LCOD estimates are calculated using the following equation:
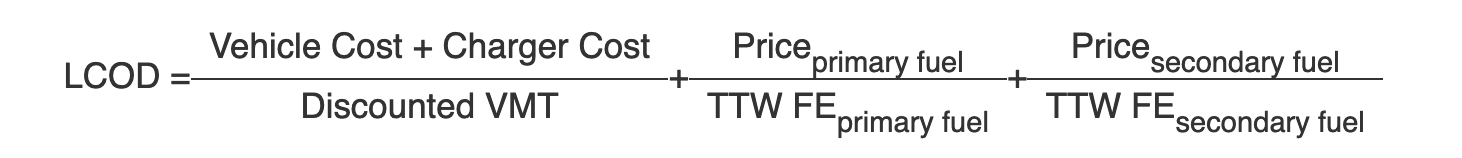
- Discounted vehicle miles traveled (VMT) represents the present value of future VMT for the life of the vehicle, computed as:

- We use the mileage schedule provided by the National Highway Traffic Safety Administration for the annual VMT (NHTSA, 2006). The administration reports that new vehicles (first year of ownership) are driven on average 14,231 miles per year, which gradually declines to 9,249 miles per year for vehicles 15 years old. Total mileage during the 15 years is 178,102 miles. In this calculation, the annual VMT are then discounted based on the assumed discount rate of 5% to bring all costs to a present value (reflecting that the costs associated with miles driven in the earlier years of vehicle ownership contribute more to the levelized cost than the cost of miles driven in later years). This methodology is used for consistency with other Department of Energy analyses (Elgowainy et al., 2016). The total discounted mileage over a 15-year life is 132,946 miles.
- The fuel price (Priceprimary fuel and Pricesecondary fuel) is converted to miles per gallon gasoline equivalent.
- TTW FE is the tank-to-wheels fuel economy for the primary and secondary fuels in miles per gallon gasoline equivalent. In the case of plug-in hybrid electric vehicles, TTW FEprimary fuel represents the average electricity consumption across charge-depleting and charge-sustaining modes, and TTW FEsecondary fuel represents the average liquid fuel consumption across charge-depleting and charge-sustaining modes. The plug-in hybrid electric vehicle fuel economies reported in the Transportation ATB include explicit assumptions on utility factors, which are based on Autonomie modeling by Islam et al. (Islam et al., 2020) and are consistent with SAE J1711.For all other vehicles, which use a single fuel, the secondary fuel term will be equal to 0.
- We include charger equipment and installation costs for battery electric vehicles and plug-in hybrid electric vehicles in the LCOD. The following charging assumptions are based on Borlaug et al. (Borlaug et al., 2020). We assume 50% plug-in hybrid electric vehicles use Level 1 chargers and 50% use Level 2 chargers, and 16% of battery electric vehicles use Level 1 chargers and 84% use Level 2 chargers. Residential Level 1 costs are assumed to be zero and Level 2 costs are assumed to be $1,836 ($550 for equipment and $1,286 for installation). Based on these assumptions, we add a charger cost of $918 for plug-in hybrid electric vehicles and an average charger cost of $1,542 for battery electric vehicles when calculating the LCOD.
- The various fuel prices are detailed on the Fuels page. The selected fuel pathways for Baseline, Lowest Cost, and Lowest CO2e Emissions fuels are shown in the Transportation ATB charts.
- The LCOD calculated here is a simplified estimate and does not include all factors that determine the cost of purchasing and operating a vehicle (e.g., maintenance costs and registration fees).
The table below summarizes the assumptions used for the LCOD.
| Assumption | Value | Source |
|---|---|---|
| Discount rate | 5% | (Elgowainy et al., 2016) |
| Vehicle life | 15 years | (Bento et al., 2018) |
| Total discounted vehicle miles traveled | 132,946 (corresponds to 178,102 total miles not discounted) | (NHTSA, 2006) |
| Charger use | 50% Level 1 and 50% Level 2 for plug-in hybrid electric vehicles ($918 total lifetime cost); 16% Level 1 and 84% Level 2 for battery electric vehicles ($1,542 total lifetime cost) | (Borlaug et al., 2020) |
| Charger equipment and installation cost | Level 1: $0 Level 2: $1,836 | (Borlaug et al., 2020) |
Studies of industrial learning-by-doing (or impact of R&D and spillovers from other industries) have found that industries tend to improve with production volume, and these "learning curves" can be used to estimate future improvement based on historical trends. In the Transportation ATB, learning effects are considered for both vehicles and fuels. The effects of learning curves saturate, declining as the volume of production increases. For vehicles, the threshold for high volume is assumed to be 200,000 vehicles/year. Because this threshold is a small fraction of vehicle sales in the United States, we assume that all powertrains could reach high-volume production. This assumption may not hold if certain powertrains appeal to the same, smaller consumer segment. Above this threshold, additional volume of vehicle production is assumed not to have an effect on vehicle cost. We assume that all vehicles except fuel cell electric vehicles are manufactured at high volume. For fuel cell vehicles, we assume a low-volume cost adder that decreases as the volume increases; see Key Assumptions. For fuels, we specify high or low volume; see Fuel Scenarios.
Vehicle cost represents an estimated cost to the consumer to purchase a new vehicle, based on modeling that includes manufacturing costs plus profit. Costs are based on high manufacturing production volume. Changes in vehicle cost reflect potential changes to manufacturing costs. These are not intended to estimate actual retail prices, which may differ from Transportation ATB vehicle costs because of external market drivers not included in the Transportation ATB (e.g., original equipment manufacturer pricing strategies, taxes, and incentives).
Fuel Metrics
This revenue is the value derived from sale of other products besides the fuel.
This is the investment in the durable physical plant for fuel production.
This is the cost of operating the fuel production facility.
This cost is a calculated estimate of what the cost of a fuel might be with either current or future technology at either low or high production volume. See Key Assumptions on the fuels pages and references for details.
The fuel (market) price is the price at which commercial fuels are sold. See table notes and references for details.
gasoline gallon equivalent; the volume of fuel that contains the same amount of energy as a gallon of gasoline. We use a value of 112,194 Btu/gal on a lower heating value basis; this value is from GREET 2018.
This is the cost of feedstock at the throat of the reactor once a mature supply industry has been established.
This is the cost of expendable inputs needed for fuel production are not converted to the fuel.
The fuel price is the price at which fuels are sold at the plant gate and does not include distribution costs or taxes. This is synonymous with the minimum fuel selling price.
This is the value derived from the sale of electricity coproduced with fuel.
This is the volume of feedstock that can be processed per unit of time.
This is the sum of the yield of each valued product from the fuel production process.
Emissions Metrics
Emissions for CO2e, NOX , SOX, and PM (2.5 and 10) are estimated for well-to-tank and well-to-wheels portions of the fuel life cycles, not including emissions associated with vehicle production. The Transportation ATB only reports absolute values of physical emissions and does not account for the social cost of carbon or other associated impacts. Note that the changes over time are attributable only to vehicle technology changes; emissions associated with fuels are held constant at the values for the selected fuel.
CO2e is the carbon dioxide equivalent of greenhouse gas emissions. The Transportation ATB considers greenhouse gas emissions from carbon dioxide, methane, and nitrous oxides, consistent with GREET. The global warming potentials are also based on GREET default values, which are based on the Intergovernmental Panel on Climate Change (IPCC) Fifth Assessment Report (AR5) (IPCC, 2014).
NOX are nitrogen oxides.
SOX are sulphur oxides.
PM is particulate matter, specifically PM10 and PM2.5, which consist of particles that have aerodynamic diameters of less than 10 and less than 2.5 microns, respectively. These metrics are reported in GREET model results.
Tank-to-wheels emissions are emissions from fuel consumption during the operation phase of the vehicle (Elgowainy et al., 2016).
Well-to-tank emissions include emissions from fuel production at the primary source of energy (feedstock) to its delivery to the vehicle's energy storage system (e.g., fuel tank or battery) (Elgowainy et al., 2016).
These are emissions from both the well to the tank and the tank to the wake (which includes fuel consumption during operation of an aircraft).
These are emissions from both the well to the tank and the tank to the wheels. Well-to-wheels emissions are presented in different units depending on the data shown.
For fuels, we present the well-to-wheels in g/mmBtu (on lower heating value basis). This represents the emissions associated with each unit of energy used onboard the vehicle and does not incorporate vehicle fuel economy. This methodology is consistent with the Renewable Fuel Standards (RFS2), which evaluate fuels on a gram per unit energy basis (EPA, 2015a); (EPA, 2010).
For vehicles, we present the well-to-wheels emissions in g/mi, which incorporates both the fuel emissions and the vehicle fuel economy. This methodology is consistent with regulations that account for potential fuel economy improvements of advanced powertrains, such as California's Low Carbon Fuel Standard (California Air Resources Board, 2019).
References
The following references are specific to this page; for all references in this ATB, see References.