Literature Context
To contextualize the 2020 Transportation Annual Technology Baseline (ATB) projections, this page presents projections of midsize light-duty vehicle cost and fuel economy from recent, publicly available literature sources.
We use these data to calculate and compare the levelized cost of driving (LCOD).
More information about the reviewed literature sources are included in the Methodology and Reviewed Literature section (below).
- Bloomberg New Energy Finance (2017). When Will Electric Vehicles be Cheaper than Conventional Vehicles?
- Burke and Zhu (2015). "The Economics of the Transition to Fuel Cell Vehicles with Natural Gas, Hybrid-Electric Vehicles as the Bridge."
- U.S. Energy Information Administration (2019). Annual Energy Outlook 2019.
- U.S. Environmental Protection Agency (2016). Proposed Determination on the Appropriateness of the Model Year 2022–2025 Light-Duty Vehicle Greenhouse Gas Emissions Standards under the Midterm Evaluation.
- Islam, Kim, Moawad, and Rousseau (2018). An Extensive Study on Sizing, Energy Consumption, and Cost of Advanced Vehicle Technologies.
- Lutsey et al. (2017). Efficiency Technology and Cost Assessment for U.S. 2025–2030 Light-Duty Vehicles.
- Moawad, Ayman, Kim, Shidore, and Rousseau (2016). Assessment of Vehicle Sizing, Energy Consumption, and Cost through Large-Scale Simulation of Advanced Vehicle-Technologies.
- National Research Council (2013). Transitions to Alternative Vehicles and Fuels.
- National Research Council (2015). Cost, Effectiveness, and Deployment of Fuel Economy Technologies for Light-Duty Vehicles.
- Ogden, Fulton, and Sperling (2016). Making the Transition to Light-Duty Electric-Drive Vehicles in the U.S.: Costs in Perspective to 2035.
The vehicle cost and performance estimates from the above sources are used in the same methodology reported in the definition of LCOD to calculate an LCOD metric. The calculated LCOD allows for a more direct comparison of total cost of ownership across the various powertrains than capital cost or vehicle performance alone. The Assumptions section (below) includes details about the LCOD calculations for the reviewed literature.
The charts below compare projected vehicle cost, fuel economy, and LCOD across powertrains from the reviewed literature to the Transportation ATB scenarios. Details about each literature source, its methodology, and assumptions can be found in the Methodology and Reviewed Literature section (below).
The reviewed literature focuses primarily on a subset of the vehicle and fuel options considered in the Transportation ATB, as listed below. Additionally, the electric vehicle ranges varied across sources, and we aggregate those different vehicles into five range categories:
- Gasoline Internal Combustion Engine Vehicles: gasoline-fueled internal combustion engine vehicles
- Gasoline Hybrid Electric Vehicles: gasoline hybrid electric vehicles
- 20-mile Plug-In Hybrid Electric Vehicles: gasoline plug-in hybrid electric vehicles with a 20-mile electric range
- Plug-in hybrid electric vehicles (PHEVs) with less than 40 miles of range
- 50-Mile Plug-In Hybrid Electric Vehicles: gasoline plug-in hybrid electric vehicles with a 50-mile electric range
- PHEVs with 40 or more miles of range
- 100-Mile Battery Electric Vehicles: battery electric vehicles (BEVs) with a 100-mile electric range
- BEVs with less than 110 miles of range
- Note that the current Transportation ATB does not include BEVs with 100-mile ranges, so ATB scenarios are not shown in the charts below.
- 200-Mile Battery Electric Vehicles: battery electric vehicles with a 200-mile electric range
- BEVs with 110 or more and less than or equal to 200 miles of range
- 300-Mile Battery Electric Vehicles: battery electric vehicles with a 300-mile electric range
- BEVs with more than 300 miles of range
- Fuel Cell Electric Vehicles (FCEVs): hydrogen fuel cell electric vehicles.
If a given literature source does not include fuel economy assumptions, it is not included in the fuel economy chart (see the Literature Overview section, below, for coverage). BEV and PHEV all-electric ranges in the following chart are considered to be values for on-road performance, which tend to be lower than tested values. Literature sources are therefore likely placed in a lower range category. The range of estimates in vehicle cost across the literature for a given powertrain may be due in part to different assumptions on battery size, future fuel economy, or vehicle production volume.
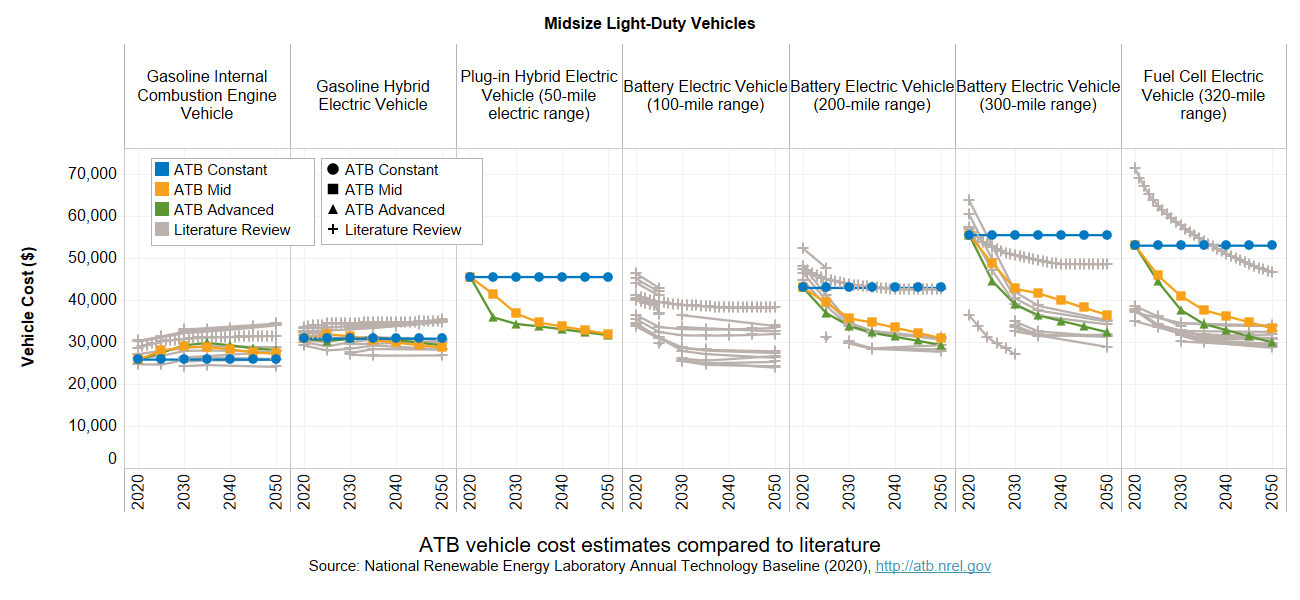
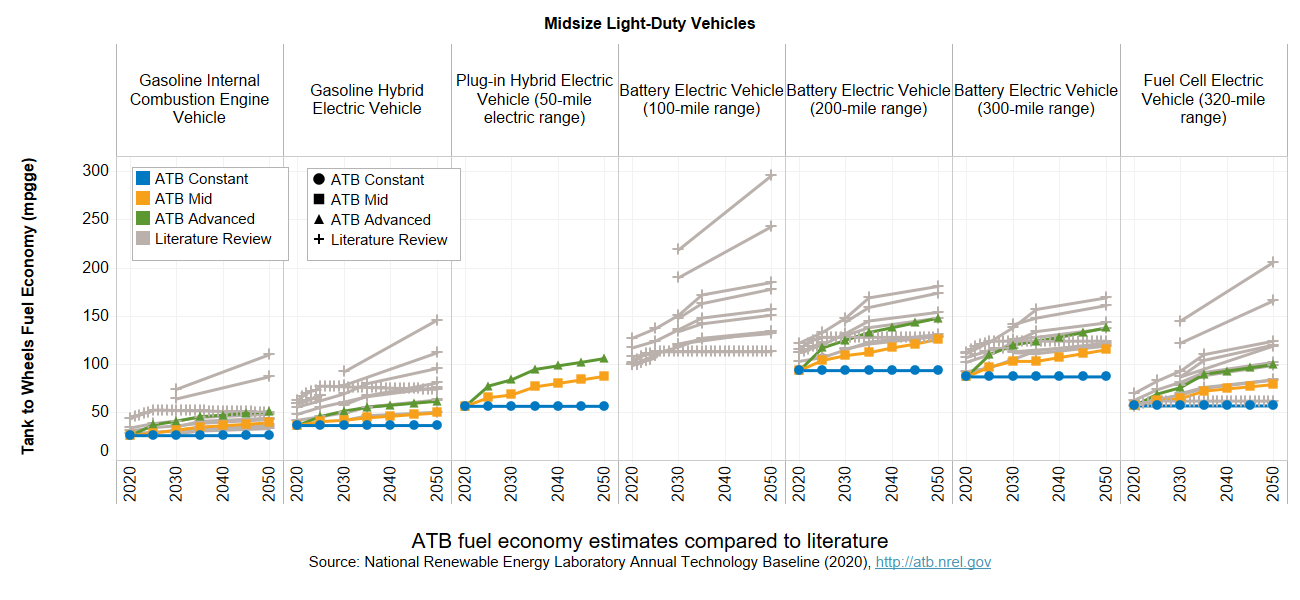
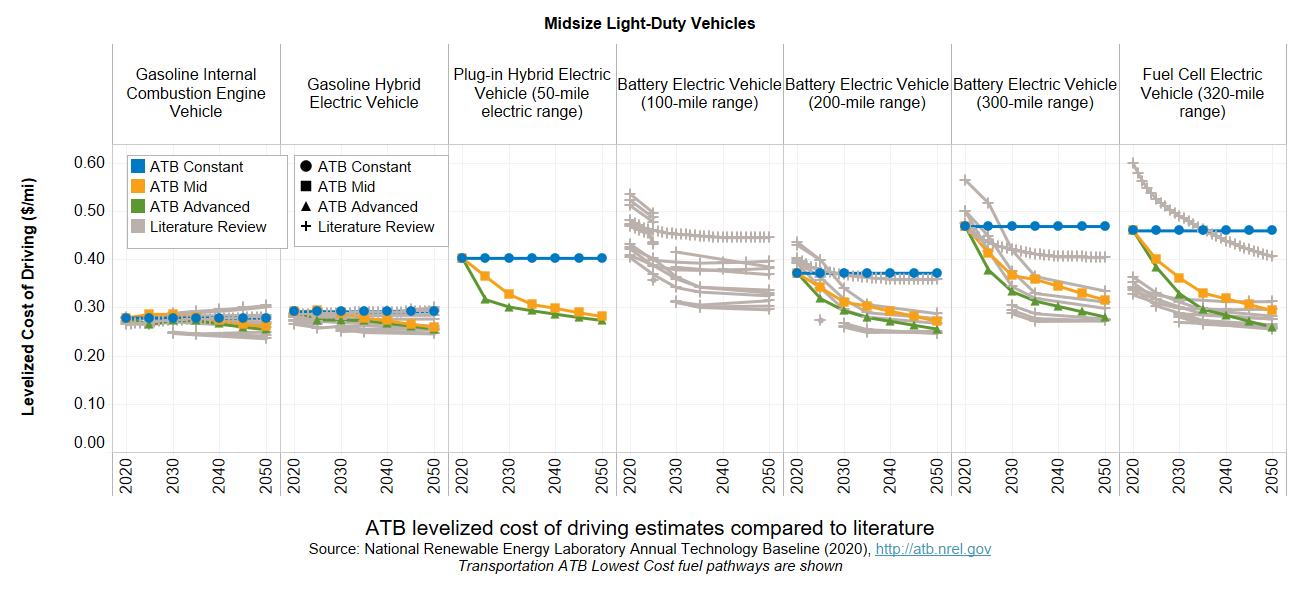
Projected vehicle cost (top) and fuel economy estimates (middle) from the literature, with a calculated LCOD (bottom) for midsize light-duty vehicles overlaid by the Transportation ATB vehicle scenarios. Fuel price is included in the LCOD and is assumed to include the cost of fuel infrastructure. Lowest cost fuel pathways are shown in the LCOD.
Key Assumptions
- The details and assumptions underlying the LCOD calculation can be found in the LCOD definition.
- No single literature source covers all the drivetrains addressed in this review. Drivetrains with less coverage may therefore show a narrower range of projections (see the Literature Overview section, below, for coverage).
- Not all sources include projections to 2050; the variation in the number of data sources for each year causes nonmonotonic behavior for some powertrains (see the Literature Overview section, below, for coverage).
- We linearly interpolate between data points for sources that do not provide estimates for each five-year increment.
- Although this analysis focuses on midsize vehicles, in 2018, 65% of the new retail vehicles sold were light-duty trucks (i.e., pickups, vans, and sport-utility vehicles) (Davis and Boundy, 2019), and projections of vehicle attributes for this vehicle class were lacking in the literature.
- To account for data sources that did not include all the inputs needed to calculate the LCOD, we make assumptions for several factors based primarily on data from the U.S. Energy Information Administration's Annual Energy Outlook 2017 (EIA, 2017).
- For sources that only report incremental costs relative to conventional vehicles, we calculate a total vehicle cost based on costs of gasoline internal combustion engine vehicles from Annual Energy Outlook 2017 (EIA, 2017).
- If a source included an estimate for vehicle cost but not one for fuel economy, we use fuel economy projections from Annual Energy Outlook 2017 (EIA, 2017)for the relevant year and powertrain, and vice versa.
Methodology and Reviewed Literature
Projection Methods
The studies considered in our review rely on different methodologies to determine the future cost and performance of light-duty vehicles. These methodologies include bottom-up techno-economic analysis of technology improvement over time, application of cost-reduction curves formulae based on learning-by-doing or experience curves, and systematic elicitation of expert opinion. Techno-economic analyses calculate the potential cost and performance improvements of each of the component technologies and of the integrated system, including effects related to large-scale production. Studies of industrial learning-by-doing (or impact of R&D and spillovers from other industries) have found that industries tend to improve with production volume, and these "learning curves" can be used to estimate future improvement based on historical trends. Expert opinion may account for emerging opportunities that other methods neglect.
Future changes in policy and technology progress may alter these trajectories. For example, the U.S. Energy Information Administration's Annual Energy Outlook projects fuel economy improvements that are limited to the current corporate average fuel economy standards, resulting in fuel economy projections that level off in 2025 (EIA, 2019). Additionally, drastic advances in battery technology in recent years have significantly changed projections for plug-in electric vehicle costs. Cost projections for electric vehicles from Annual Energy Outlook 2017 are considerably lower than those in Annual Energy Outlook 2016, with projected prices for a BEV-100 and a BEV-200 in 2040 decreasing by close to 16% and 24% respectively (EIA, 2016b); (EIA, 2017). However, vehicle cost projections in Annual Energy Outlook 2019 have increased from the 2018 estimates (EIA, 2018a); (EIA, 2019). Recent analyses suggest that current battery cost projections in the literature may still be overestimating real market costs (Kittner et al., 2017). Therefore, while these results show the current understanding of the potential evolution of light-duty vehicles, considerable uncertainty remains, and the range of results may not reflect all potential future pathways. (Kittner et al., 2017).
Literature Overview
We consider 64 literature sources published after 2013, based on a literature search for relevant terms, and conversations with subject matter experts. Reducing this initial set to include only sources that report original projections for vehicle cost and/or fuel economy (sources with only current estimates were not included) yields 10 sources for midsize light-duty vehicles.
The studies reviewed use various assumptions and models to project fuel economy and vehicle cost for each vehicle type. The U.S. Energy Information Administration's Annual Energy Outlook, which includes cost and fuel economy projections for a wide range of light-duty powertrains developed using the National Energy Modeling System (NEMS), is a widely referenced source (EIA, 2019). The Autonomie vehicle system modeling tool and the BatPaC battery cost model, both developed at Argonne National Laboratory, are also prominent tools in this space (Argonne National Laboratory, 2019b); (Argonne National Laboratory, 2019a). The table below summarizes the methods used by all the sources we consider here. Each individual source is summarized in the Literature Descriptions section (below).
| Reference | Method | Models Used | Scenarios | Vehicle Cost Type | Included Projections | Time Horizon | ICEV | HEV | PHEV | BEV | FCEV |
|---|---|---|---|---|---|---|---|---|---|---|---|
| BNEF (2017) | TEA | Reference | Total | Costs, Fuel Economy | 2025 | X | - | - | X | - | |
| Burke and Zhu (2015) | TEA | ADVISOR | Reference | Total | Costs, Fuel Economy | 2030 | - | - | - | - | X |
| EIA (2019) | Learning/TEA | NEMS | Reference | Total | Costs, Fuel Economy | 2050 | X | X | X | X | X |
| EPA (2016) | Learning | BatPaC, OMEGA | Reference | Incremental | Costs | 2025 | - | X | X | X | - |
| Islam et al. (2018) | TEA | Autonomie | Conservative, Reference, Optimistic | Total | Costs, Fuel Economy | 2050 | X | X | X | X | X |
| Lutsey et al. (2017) | TEA | OMEGA | Reference | Incremental | Costs, Fuel Economy | 2025 | - | - | - | X | - |
| Moawad et al. (2016) | TEA | Autonomie | Conservative, Reference, Optimistic | Total | Costs, Fuel Economy | 2050 | X | X | X | X | X |
| NRC (2013) | TEA | Reference, Optimistic | Incremental | Costs | 2050 | X | X | X | X | X | |
| NRC (2015) | TEA | BatPaC | Reference, Optimistic | Incremental | Costs | 2025 | - | X | X | X | - |
| Ogden et al. (2016) | Learning | Reference, Optimistic | Incremental | Costs | 2035 | X | X | X | X | X |
TEA is techno-economic analysis. HEV is hybrid electric vehicle. ICEV is internal combustion engine vehicle. Learning is based on learning curves.
Of the 10 literature sources included in this review and listed in the next section, the U.S. Energy Information Administration's Annual Energy Outlook, and analyses from Argonne National Laboratory and National Research Council are the most comprehensive studies and cover the most vehicle technologies. We note a lack of other comparable original analyses for projected vehicle costs, especially for projections beyond 2025 and for other vehicle sizes. The literature also emphasizes plug-in electric vehicles and FCEVs over other advanced vehicles (e.g., those using compressed natural gas).
Literature Descriptions
Bloomberg New Energy Finance (2017)
This analysis was primarily based on techno-economic modeling and internal expert solicitation. Forecasts assumed current policies continue until their set expiration. The Forecasts did not assume the introduction of any new legislation. Nor did the report assume climate targets were met (Soulopoulos, 2017).
Burke and Zhu (2015)
This analysis compared near-term costs of FCEVs. The ADVISOR vehicle simulation program, with modifications from the University of California, Davis, was used to estimate vehicle fuel economy for natural gas HEVs and hydrogen FCEVs. The authors assumed increasing sales for these powertrains in the years beyond 2020 to reduce some of the price uncertainty in the projected component costs associated with today's low production volumes (Burke and Zhu, 2015).
U.S. Energy Information Administration (2019)
This source used the Transportation Sector Demand Module of NEMS for vehicle cost and performance projections (EIA, 2018b); (EIA, 2016a). NEMS factored in fuel economy regulations, technology cost-effectiveness, and consumer preference for vehicle performance to develop future vehicle configurations. Li-ion battery costs were adjusted to reflect global learning-by-doing, and additional component costs were estimated exogenously based on assumed production volumes (the high production level starts at 50,000 units) (EIA, 2018b).
U.S. Environmental Protection Agency (2016)
This analysis evaluated the current state and future outlook of vehicle technologies included in the final rulemaking for the 2022–2025 model year corporate average fuel economy standards (EPA, 2016). The U.S. Environmental Protection Agency based the projected costs on a vehicle tear-down analysis with an assumed production volume of 450,000 units per year for a given powertrain technology (EPA, 2016).
Islam et al. (2018)
This updated analysis from Argonne National Laboratory modeling of more than 5,000 vehicles estimated the benefits offered by a wide range of vehicle configurations in terms of the evolution of component costs and performance. Researchers consulted with experts from industry, academia, and within the national laboratory network to develop low, medium, and high uncertainty cases.
Moawad et al. (2016)
This analysis, which was performed at Argonne National Laboratory, is one of the most comprehensive in our selected resources. It provides the projected cost and performance of light-duty vehicles across multiple powertrains and for different sizes through 2050 for multiple scenarios. The low technology improvement (conservative) case was meant to align with assumed improvements from original equipment manufacturers to adhere to regulations, while the high technology improvement (optimistic) case assumed the technology improvement goals of the U.S. Department of Energy are met (Moawad et al., 2016).
National Research Council (2013)
This prominent study considered the potential for alternative vehicles and fuels to achieve fuel and greenhouse gas emissions reductions through 2050. The analysis assumed high production volumes to develop vehicle component costs, which were based on cost estimates from the literature (NRC, 2013).
National Research Council (2015)
This report summarized future vehicle technology component costs and fuel economy estimates based primarily on the 2017–2025 technology standard analysis published by National Highway Traffic Safety Administration and the Environmental Protection Agency. These data were then refined by input from the research committee, industry experts, and a literature review (NRC, 2015).
Ogden, Fulton, and Sperling (2016)
This University of California, Davis, study estimated the total investment needed to make the cost of electric drive vehicles competitive with incumbent vehicle technology under various policy scenarios. These scenarios were developed based on a vehicle adoption model (STEPS Transition Model). Most vehicle component costs were sourced from NRC (NRC, 2013), and some updates were made to account for more-recent estimates of battery cost reductions (Ogden et al., 2016).
Lutsey et al. (2017)
This source examined the projected costs to meet European greenhouse gas standards from 2020 to 2030, based on a literature review of technology costs for BEVs, PHEVs, and FCEVs. It also compiled previous analysis of future greenhouse gas emissions and trends in vehicle energy demand to inform the likelihood of reaching near-term emissions goals (Lutsey et al., 2017).
References
The following references are specific to this page; for all references in this ATB, see References.