Residential PV
Units using capacity above represent kWDC.
2023 ATB data for residential solar photovoltaics (PV) are shown above, with a Base Year of 2021. The Base Year estimates rely on modeled capital expenditures (CAPEX) and operation and maintenance (O&M) cost estimates benchmarked with industry and historical data. Capacity factor is estimated based on hours of sunlight at latitude for 10 resource categories in the United States, binned by mean global horizontal irradiance (GHI). The 2023 ATB presents capacity factor estimates that encompass a range associated with advanced, moderate, and conservative technology innovation scenarios across the United States. Future year projections are derived from bottom-up benchmarking of PV CAPEX and bottom-up engineering analysis of O&M costs. The year 2022 reflects the most recent historical data, derived from benchmarks made in the first quarter of 2022. Specific projections are made for 2035 and 2050 only. Straight lines interpolate between the 2022 and 2035 values, and between the 2035 and 2050 values. Cost fluctuations that may occur between each set of years are not represented, such as the fluctuations due to policy and market conditions that have occurred after the first quarter of 2022.
The three scenarios for technology innovation are:
- Conservative Technology Innovation Scenario (Conservative Scenario): lower levels of R&D investment with minimal technology advancement and global module pricing consistent with the base year
- Moderate Technology Innovation Scenario (Moderate Scenario): R&D investment continuing at similar levels as today, with no substantial innovations or new technologies introduced to the market
- Advanced Technology Innovation Scenario (Advanced Scenario): an increase in R&D spending that generates substantial innovation, allowing historical rates of development to continue.
Resource Categorization
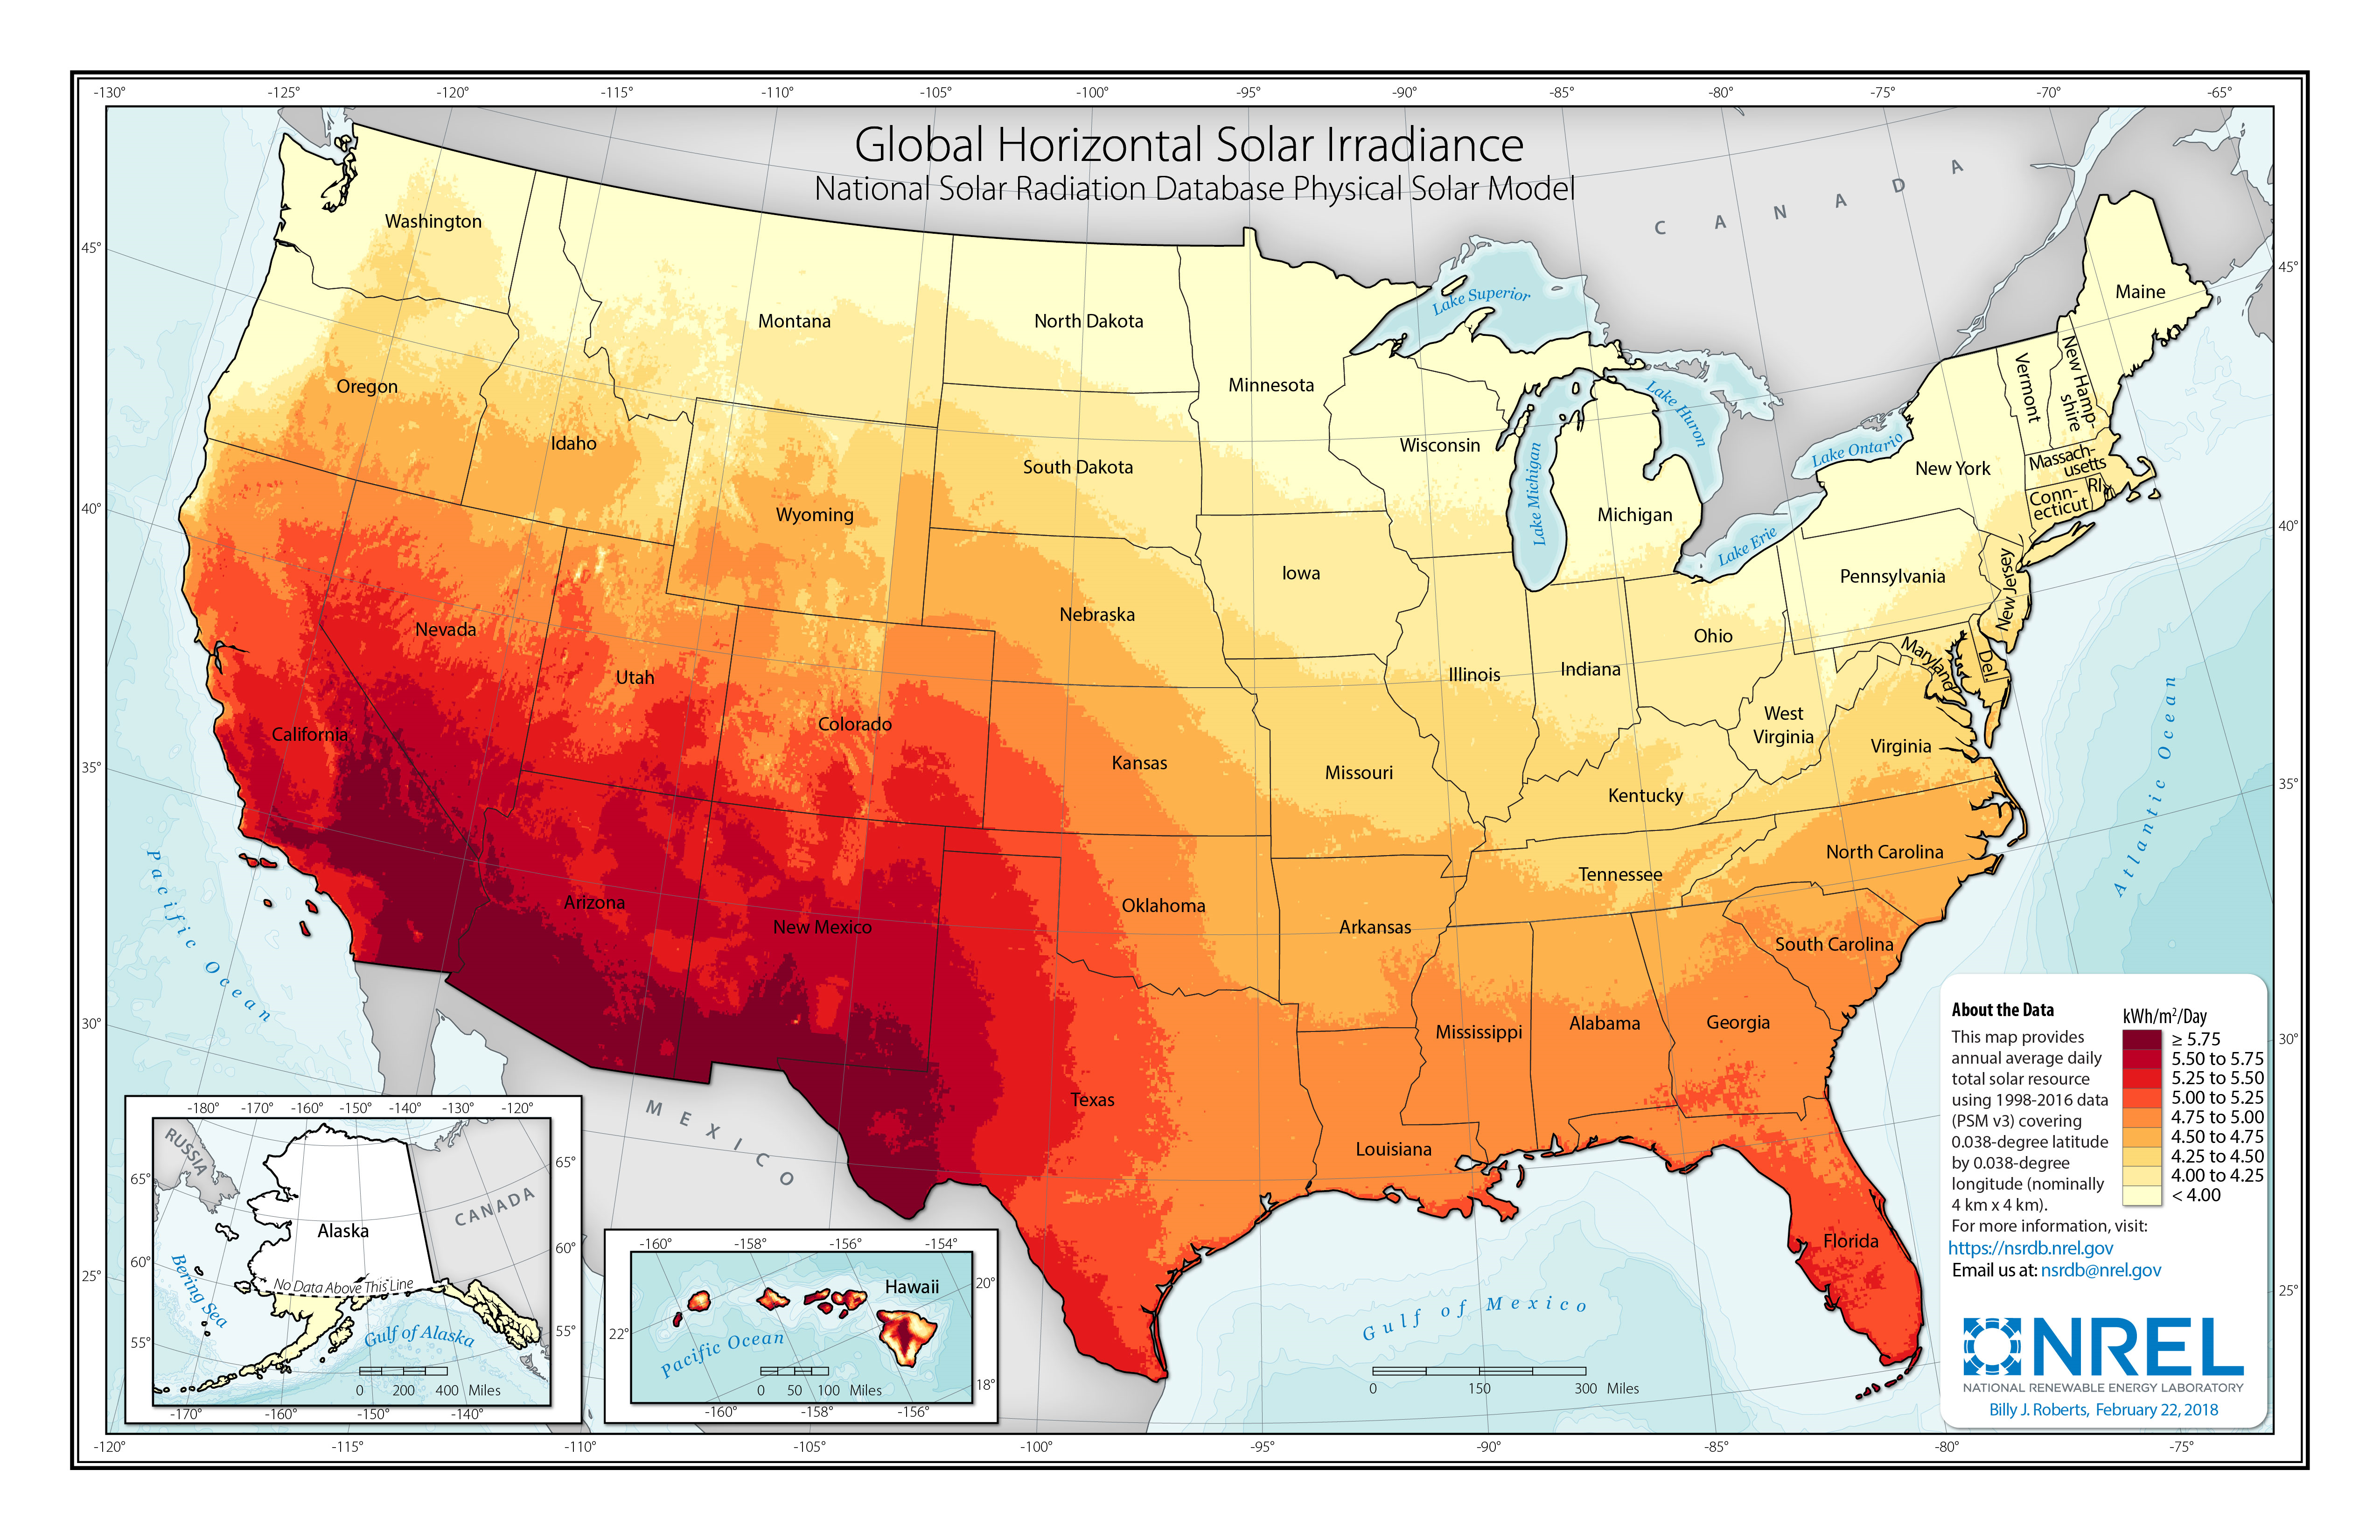
The 2023 ATB provides the average capacity factor for 10 resource categories in the United States, binned by mean GHI. The annual average capacity factor for the contiguous United States is calculated using the Renewable Energy Potential (reV) model using solar resource data for 2012 from the National Solar Radiation Database (NSRDB). The county-level capacity factors are calculated for specific locations with azimuth and tilt, which are based on representative agents selected in the Distributed Generation Market Demand Model (dGen) 2020 Standard Scenarios agent database (Sigrin et al., 2016). A lookup table for these locations and the NSRDB is generated based on nearest distance. The azimuth and tilt as well as the resource GHI are used to generate a System Advisor Model (SAM) config file and to run reV, which outputs the annual average capacity factor at each evaluated location. The U.S. average capacity factor for each resource category is weighted by the population of each county within the GHI resource category. The county estimated populations are provided by geospatial and tabular data from the U.S. Census. The map below shows average annual GHI in the United States.
The following table summarizes estimated 2019 capacity factors (in the first year of operation) for each resource category and each resource category's associated population.
| Resource Class | GHI Bin (kWh/m2/day) | Mean DC Capacity Factor | Population |
| 1 | >5.75 | 19.6% | 12,554,678 |
| 2 | 5.5–5.75 | 19.3% | 21,403,290 |
| 3 | 5.25–5.5 | 18.0% | 13,476,871 |
| 4 | 5–5.25 | 17.0% | 30,603,630 |
| 5 | 4.75–5 | 16.1% | 45,176,116 |
| 6 | 4.5–4.75 | 15.9% | 39,880,837 |
| 7 | 4.25–4.5 | 15.2% | 31,742,606 |
| 8 | 4–4.25 | 14.5% | 80,155,804 |
| 9 | 3.75–4 | 13.9% | 40,755,023 |
| 10 | <3.75 | 12.7% | 10,255,830 |
| Mean | 15.7% |
Scenario Descriptions
| Scenario | Module Efficiency1 | Inverter and Power Electronics | Installation Efficiencies | Energy Yield Gain1 |
|---|---|---|---|---|
| Conservative Scenario | Technology Description: A U.S. minimum sustainable price (MSP) is assumed, which excludes import tariffs, plus a supply chain premium for small installers. Module efficiency is based on the lowest projected efficiency for monocrystalline silicon technologies from the International Technology Roadmap for Photovoltaic (ITRPV) in 2032, resulting in a price of $0.43/WDC. Justification: This scenario represents the low end of long-term module efficiency-improvement expectations applied to a U.S. MSP including a supply chain premium for small installers. | Technology Description: This scenario assumes a larger market size. Justification: The global PV industry is expected to continue to expand. | N/A | N/A |
| Moderate Scenario | Technology Description: The module price is halfway between the price in the Conservative Scenario and the price in the Advanced Scenario, or $0.37/WDC. Module efficiency is based on the projected efficiency consistent with TOPCon (tunnel oxide passivated contact) and SHJ (silicon heterojunction) modules in the ITRPV in 2032. Justification: This scenario represents a moderate long-term module efficiency-improvement expectation applied to a module basis halfway between a U.S. MSP and a global spot price, including a supply chain premium for small installers. | Technology Description: This scenario assumes design simplification and manufacturing automation. Justification: Industry is transitioning toward greater simplification and automation. | Technology Description: This scenario assumes 20% labor and hardware balance-of-system (BOS) cost improvements through automation, preassembly of racking, mounting, and wiring efficiencies, and improvements in wind load design. It also assumes a switch in deployments to be a standard feature of the construction of a house or a normally scheduled reroofing event. Justification: Because residential PV systems represent a smaller investment in absolute dollars, soft costs —such as customer acquisition, permitting, interconnection, and overhead—contribute a significantly higher percentage of CAPEX than they do with larger PV systems. Incorporating the PV system into a larger related construction project, such as a reroofing or the construction of a new house, could create significant efficiencies to customer acquisition costs and to permitting, inspection, and interconnection costs, as well as reduced costs through efficiencies in labor and structural BOS. (Feldman et al., 2021) found that PV systems in new homes were 24% less expensive than retrofit residential PV systems. | Technology Description: This scenario assumes a degradation rate reduction from 0.7%/yr to 0.5%/yr. Justification: Significant R&D is currently spent on improved cell temperatures and lower degradation rates. Degradation rates of 0.5%/yr are already common for some developers. |
| Advanced Scenario | Technology Description: A global module spot price is assumed as the price basis, plus a supply chain premium for small installers. Module efficiency is based on the projected efficiency halfway between the efficiency of TOPCon and SHJ modules and tandem modules in the ITRPV in 2032, resulting in a price of $0.30/WDC. Justification: This scenario represents a relatively high long-term module efficiency-improvement expectation applied to a global spot price, including a supply chain premium for small installers. | Technology Description: This scenario assumes design simplification and manufacturing automation. Justification: The power electronics industry already has road maps to simplify and automate current products, and there is more potential with increased industry size. | Technology Description: This scenario assumes 40% labor and hardware BOS cost improvements through automation and preassembly of racking, mounting, and wiring efficiencies. It also assumes a switch in deployments to be a standard feature of the construction of a house or a normally scheduled reroofing event (e.g., new construction or reroofing). Justification: In addition to the justifications listed above, there is potential for a national streamlined permitting process, with efforts that are currently underway. For example, the Solar Automated Permit Processing platform (SolarAPP+) is an instant online solar permitting tool for code-compliant residential systems. | Technology Description: This scenario assumes a degradation rate reduction from 0.7%/yr to 0.2%/yr. Justification: Significant R&D is currently spent on improved cell temperatures and lower degradation rates. Degradation rates of 0.2%/yr are currently being pursued. |
| Impacts |
|
|
|
|
| References |
1 Module efficiency improvements represent an increase in energy production over the same area, in this case the dimensions of a PV module. Energy yield gain represents an improvement in capacity factor relative to the rated capacity of a PV system.
Scenario Assumptions
The technology-improvement scenarios for residential PV described above result in CAPEX reductions of 24% (Conservative Scenario), 47% (Moderate Scenario), and 62% (Advanced Scenario) between 2022 and 2035. We assume these CAPEX reductions follow straight lines between 2022 and 2035. The average annual reduction rates are 2.1% (Conservative Scenario), 4.7% (Moderate Scenario), and 7.2% (Advanced Scenario).
Similarly, we assume straight-line CAPEX reductions between 2035 and 2050, as described below. Between these 2 years, the CAPEX reductions are 29% (2.3% per year average) for the Conservative Scenario, 29% (2.3% per year average) for the Moderate Scenario, and 22% (1.6% per year average) for the Advanced Scenario.
Although we did not create our CAPEX projections based on rates of deployment, residential PV deployment is expected to increase substantially over our analysis period. For example, in the National Laboratory of the Rockies (NLR) Standard Scenarios Mid-case, U.S. distributed PV deployment (including residential and other distributed systems) grows by over 300% between 2022 and 2035 (from 31 GW to 131 GW), and by 32% between 2035 and 2050 (from 131 GW to 173 GW) (Gagnon et al., 2022).
Representative Technology
For the 2023 ATB, residential PV systems are modeled for a 7.9-kWDC, fixed tilt, roof-mounted system with a 1.21 DC-to-AC ratio, or inverter loading ratio (ILR) (Ramasamy et al., 2022). Flat-plate PV can use direct or indirect insolation, so PV modules need not directly face and track incident radiation. The county-level capacity factors are calculated for specific locations, which are based on representative agents selected in the dGen 2020 Standard Scenarios agent database (Sigrin et al., 2016). At each location, various tilt/azimuth combinations are evaluated, and the optimal combination is chosen for modeling. The ability to use direct and indirect insolation gives rooftop PV systems a broad geographical application.
Methodology
This section describes the methodology to develop assumptions for CAPEX, O&M, and capacity factor. For standardized assumptions, see regional cost variation, materials cost index, scale of industry, policies and regulations, and inflation. The PV-specific and standardized assumptions for labor cost differ; the PV analysis assumes use of nonunion labor only.
Currently, CAPEX—not levelized cost of energy (LCOE)—is the most common metric for PV cost. Because of different assumptions in long-term incentives, system location and production characteristics, and cost of capital, LCOE can be confusing and often noncomparable for different estimates. Though CAPEX also has many assumptions and interpretations, managing it involves fewer variables. Therefore, PV projections in the 2023 ATB are driven entirely by upfront and operating cost improvements.
Three projections are developed for scenario modeling as bounding levels (see the scenario list above).
Capital Expenditures (CAPEX)
Definition: Capital expenditures (CAPEX) are expenditures required to achieve commercial operation in a given year. For residential PV, this is modeled for only a host-owned business model.
For the 2023 ATB—and based on the NLR PV cost model (Ramasamy et al., 2022)—the residential PV envelope is defined to include items noted in the Components of CAPEX table below.
Base Year: Reported residential PV installation CAPEX (Barbose et al., 2022) is shown (see chart below) in box-and-whiskers format through 2020 along with benchmarked CAPEX in 2021 (Ramasamy et al., 2021) and 2022 (Ramasamy et al., 2022) and projections from the 2023 ATB. The data in (Barbose et al., 2022) represent 77% of all U.S. residential PV and commercial PV capacity installed through 2021.
Historical Sources: (Barbose et al., 2022); (Ramasamy et al., 2022)
Future Projections: 2023 ATB
Reported and benchmark prices can differ for a variety of reasons, as outlined by Barbose and Darghouth (Barbose et al., 2019), Bolinger, Seel, and Robson (Bolinger et al., 2019), and (Ramasamy et al., 2022), including:
- Timing-Related Issues: For example, the time between contract completion and project placement in service may vary.
- System Variations: The size, technology, installer margin, and design of systems installed in a given year vary over time.
- Cost Categories: There are variations in which cost categories are included in CAPEX (e.g., financing costs and initial O&M expenses).
Federal investment tax credits provide an incentive to include costs in the up-front CAPEX to receive a higher tax credit, and these included costs may have otherwise been reported as operating costs. The bottom-up benchmarks are more reflective of an overnight capital cost, which is in-line with the ATB methodology of inputting overnight capital cost and calculating construction financing to derive CAPEX.
Residential PV pricing and capacities are quoted in kWDC (i.e., module rated capacity) unlike other generation technologies (including utility-scale PV), which are quoted in kWAC. This is because kWDC is the unit that most of the residential PV industry uses. Although costs are reported in kWDC, the total CAPEX includes the cost of the inverter, which has a capacity measured in kWAC.
CAPEX estimates for 2022 reflect analysis of recent system cost and pricing for projects that became operational in 2022 (Ramasamy et al., 2022). Although the PV technologies vary, typical installation costs are represented with a single estimate per innovation scenario, because residential PV CAPEX does not correlate well with solar resource. Although the technology market share may shift over time with new developments, the typical installation cost is represented with the projections above.
System prices of $2.86/WDC in 2021 and $2.95/WDC in 2022 are based on bottom-up benchmark analysis reported by (Ramasamy et al., 2021) and (Ramasamy et al., 2022).
The Base Year CAPEX estimates should tend toward the low end of observed cost, because no regional impacts are included. These effects are represented in the historical market data.
Future Years: Projections of 2035 residential PV system CAPEX are based on bottom-up cost modeling, with 2022 values from (Ramasamy et al., 2022) and a straight-line change in price in the intermediate years between 2022 and 2035. The system design and price changes made in the models are summarized and described in the Summary of Technology Innovations by Scenario table. See Cost Details by Scenario below for the details of changes to components of system price in the different ATB scenarios.
We assume each scenario's 2050 CAPEX is the equivalent of the 2035 CAPEX of the scenario but one degree more aggressive, with a straight-line change in price in the intermediate years between 2035 and 2050. In the table below, asterisks and daggers indicate corresponding cells, where scenarios use the same values but are shifted in time. We also develop and model a scenario one degree more aggressive than the Advanced Scenario to estimate its 2050 CAPEX. The 2050 Advanced Scenario assumes:
- Module efficiency of 28%
- Further inverter simplification and manufacturing automation
- 50% labor and hardware BOS cost improvements through automation and preassembly of racking, mounting, and wiring
- Carbon fiber replaces steel and aluminum , which cuts material costs in half.
- PV systems become a standard feature of the construction of a house or during a normally scheduled reroofing event (i.e., new construction/reroof).
| Year | Advanced Scenario (Increased R&D) | Moderate Scenario (Current R&D) | Conservative Scenario (Decreased R&D) |
|---|---|---|---|
| 2035 | *Residential PV CAPEX: $1.12/WDC | † Residential PV CAPEX: $1.58/WDC | Residential CAPEX: $2.23/WDC |
| 2050 | $0.87/WDC | *$1.12/WDC | † $1.58/WDC |
More-aggressive scenarios reach given CAPEX sooner, as indicated by the asterisks and daggers.
We compare the CAPEX scenarios over time to three analyst projections, adjusted for inflation. The median of those projections is displayed in the figure below through 2030. The 2023 ATB CAPEX projections are bracketed by the other projections through 2030. Only one of the analyst projections reaches 2050, so data points with which to compare the ATB projections are limited; however, the Conservative Scenario is in-line with the single analyst projection in 2050.
Sources: 2023 ATB; (BNEF, 2022); (Wood Mackenzie, 2022); (EIA, 2022)
Use the following table to view the components of CAPEX.
Operation and Maintenance (O&M) Costs
Definition: Operation and maintenance (O&M) costs represent the annual expenditures required to operate and maintain a PV system over its lifetime, including items noted in the table below.
Base Year: Fixed O&M (FOM) of $30/kWDC-yr is based on modeled pricing for a residential PV system quoted in Q1 2021 as reported by (Ramasamy et al., 2021). Lawrence Berkeley National Laboratory collected feedback from U.S. solar industry professionals (Wiser et al., 2020). The wide range in reported prices depends in part on the maintenance practices that exist for a particular system. These cost categories include asset management (including compliance and reporting for incentive payments), insurance products, cleaning, vegetation removal, and component failure. Not all these practices are performed for each system; also, some factors depend on the quality of the parts and construction. NLR analysts estimate O&M costs can range from $0 to $40/kWDC-yr.
Future Years: FOM of $31/kWDC-yr for 2022 is based on pricing reported by (Ramasamy et al., 2022), which can be divided into system-related expenses ($28/kWDC-yr) and administration-related expenses ($3/kWDC-yr). From 2022 to 2050, FOM is based on the ratio of O&M costs ($/kW-yr) to CAPEX costs ($/kW), which was 0.95:100 in 2022 as reported by (Ramasamy et al., 2022). Historical data suggest O&M and CAPEX cost reductions are correlated; from 2010 to 2020, benchmark residential PV O&M fell 49% and PV CAPEX fell 64%, as reported by (Feldman et al., 2021). Administrative expenses are kept constant.
Use the following table to view the components of O&M.
Capacity Factor
Definition: The capacity factor represents the expected annual average energy production divided by the annual energy production assuming the system operates at rated capacity for every hour of the year. It is intended to represent a long-term average over the lifetime of the system; it does not represent interannual variation in energy production. Future year estimates represent the estimated annual average capacity factor over the technical lifetime of a new system installed in a given year.
Residential PV system capacity factor is not directly comparable to other technologies' capacity factors. Other technologies' capacity factors (including utility-scale PV) are represented exclusively in AC units (see Solar PV AC-DC Translation). However, because residential PV pricing in the 2023 ATB is represented in $/WDC, residential PV system capacity is a DC rating. Because each technology uses consistent capacity ratings, the LCOEs are comparable.
The capacity factor is influenced by the hourly solar profile, technology (e.g., thin-film or crystalline silicon), expected downtime, and inverter losses to transform from DC power to AC power. The DC-to-AC ratio is a design choice that influences the capacity factor.
The baseline PV system capacity factor incorporates an assumed degradation rate of 0.7%/yr in the annual average calculation.
R&D could lower degradation rates of PV system capacity factor; future projections for the Moderate Scenario and the Advanced Scenario reduce degradation rates by 2035, using a straight-line basis, to 0.5%/yr and 0.2%/yr respectively. The Conservative Scenario assumes no improvement in degradation rates through 2035.
Base Year: In the interactive data chart at the top of this page, select Technology Detail = All to add filters to the initial figure showing a range of capacity factors based on variation in solar resource in the contiguous United States. The ATB provides the average capacity factor for 10 resource categories in the United States, binned by mean GHI. The annual average capacity factor for the contiguous United States is calculated using the reV model using solar resource data for 2012 from the NSRDB. The county-level capacity factors are calculated for specific locations with azimuth and tilt, which are based on representative agents selected in the dGen 2020 Standard Scenarios agent database (Sigrin et al., 2016). A lookup table for these locations and the NSRDB is generated based on nearest distance. The azimuth and tilt as well as the resource GHI are used to generate a SAM config file and to run reV, which outputs the annual average capacity factor at each evaluated location. U.S. average capacity factor for each resource category is weighted by the population of each county within the GHI resource category. The county estimated populations are provided by geospatial and tabular data from the U.S. Census.
First-year operation capacity factors as modeled range from 12.7% for Class 10 (for locations with an average annual GHI less than 3.75) to 19.6% for Class 1 (for locations with an average annual GHI greater than 5.75). Actual systems will vary significantly depending on location and system configuration (e.g., south-facing or west-facing).
Over time, PV installation output is reduced because of degradation in module quality, which is accounted for in ATB estimates of capacity factor over the 30-year lifetime of the system. The adjusted average capacity factor values in the 2021 ATB base year range from 12.0% for Class 10 (for locations with an average annual GHI less than 3.75) to 18.6% for Class 1 (for locations with an average annual GHI greater than 5.75).
Future Years: Projections of capacity factors for systems installed in future years increase over time because of reduced system losses, and a straight-line reduction in PV system degradation rates from 0.7%/yr that reach 0.5%/yr and 0.2%/yr by 2035 for the Moderate Scenario and the Advanced Scenario respectively. The Conservative Scenario assumes no improvement in degradation rates through 2035. The following table summarizes the difference in average capacity factor in 2035 caused by these changes in the technology innovation scenarios. Similar to our CAPEX assumptions, we assume each scenario's 2050 capacity factor is the equivalent of the 2035 capacity factor of the scenario but one degree more aggressive, with a straight-line change in the intermediate years between 2035 and 2050.
| Scenario (degradation rate) | Average Capacity Factor in 2035 (Class 10 - Class 1) | Percentage Improvement from Base Year (2021) |
|---|---|---|
| Advanced Scenario (0.20%/yr) | 12.5%–19.3% | 3.8% |
| Moderate Scenario (0.50%/yr) | 12.2%–18.8% | 1.5% |
| Conservative Scenario (0.7%/yr) | 12.0%–18.5% | 0.0% |
PV systems have very little downtime, and inverter efficiency is already optimized. Even so, there is potential for future increases in capacity factors through technological improvements beyond lower degradation rates, such as less panel reflectivity and improved performance in low-light conditions.
References
The following references are specific to this page; for all references in this ATB, see References.