Technologies
The 2022 Transportation Annual Technology Baseline (ATB) provides detailed cost and performance data, estimates, and assumptions for vehicle and fuel technologies in the United States.
The Transportation ATB includes current and projected estimates: time-series through 2050 for light, medium, and heavy-duty on-road vehicle technologies; scenarios for conventional and alternative fuels. It details the assumptions used to calculate those costs, such as natural gas and electricity prices, discount rates, and vehicle miles traveled. At this time, the ATB does not include other vehicles such as buses, 2- and 3-wheeled motorized vehicles, or non-road vehicles such as aircraft, vessels, locomotives, and those for industry and agriculture.
Explore interactive charts of vehicle and fuels data using the technology menu to the left, or explore the 2022 Transportation ATB documentation below.
Description of Data
The Transportation ATB provides data in a series of interactive charts for either a single year or a trajectory out to 2050 showing:
| Fuel economy, which is reported in miles per gallon gasoline equivalent and represents how efficiently a vehicle converts fuel during operation | 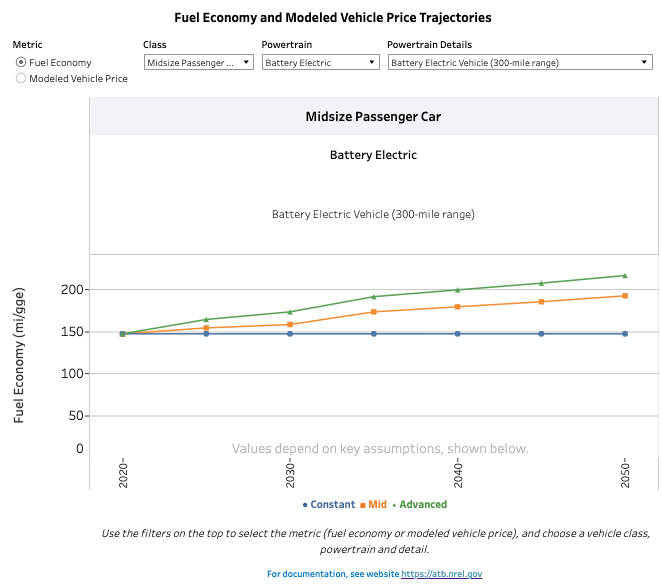 |
| Modeled Vehicle Price ,which represents an estimated cost, including manufacturing costs and profit, to the consumer purchasing a new vehicle | 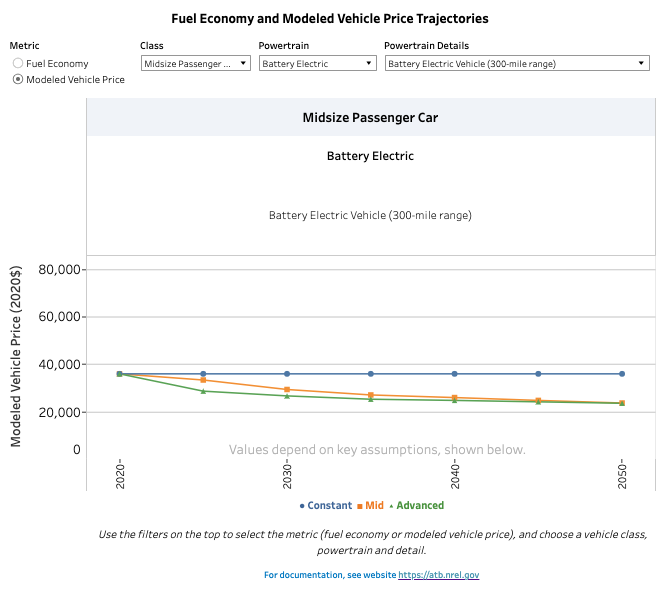 |
| Levelized cost of driving, which is an indicator of the cost of operation over the vehicle lifetime on a per-mile basis | 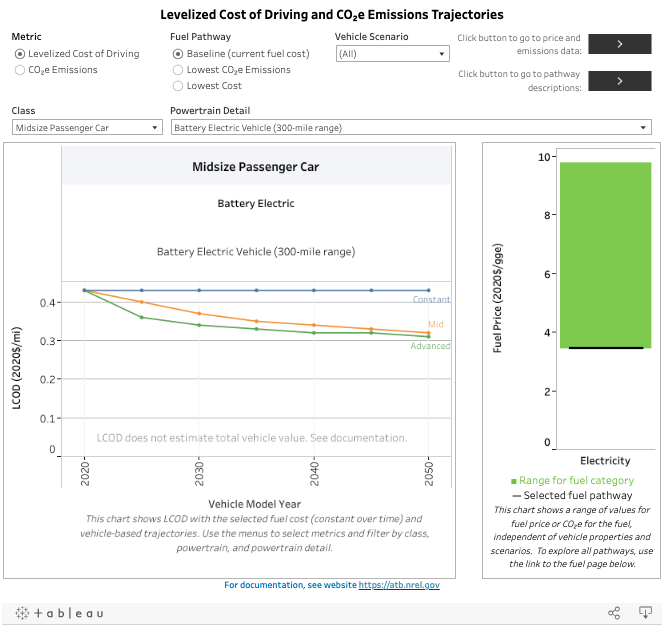 |
| Emissions, which represent the well-to-wheels emissions (including emissions from fuel production to vehicle operation). | 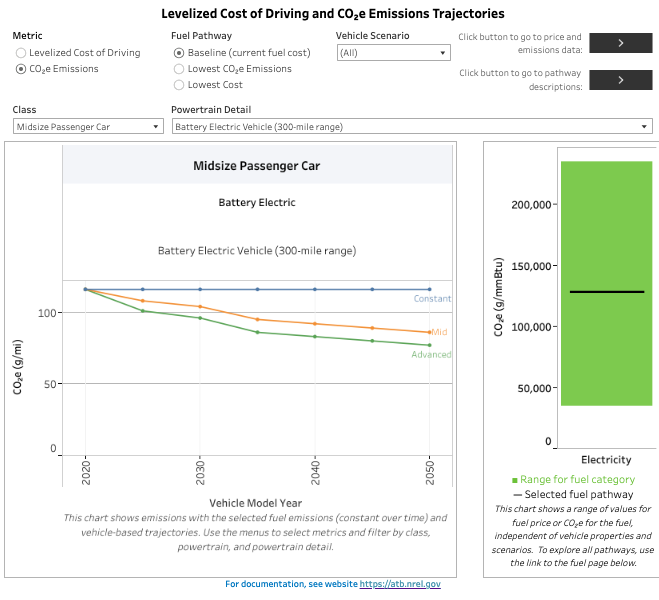 |
The Transportation ATB presents these metrics for individual powertrains and in comparison with other powertrains. In addition, it provides fuel price and well-to-tank and well-to-wheels emissions data for select fuels, including:
- On-road vehicle fuels
- Aviation fuels
- Marine fuel.
The charts for levelized cost of driving and emissions draw from a subset of fuels documented in the Transportation ATB. The full set of data can be downloaded and explored. In addition, each individual powertrain can be explored.
Key assumptions and references are presented, and their details should guide interpretation, particularly when comparing technologies. Related links from Argonne National Laboratory include the Autonomie powertrain simulation tool, the Benefits Analysis tool for techno-economic impact of individual vehicle technologies, and the Greenhouse gases, Regulated Emissions, and Energy use in Technologies Model (GREET).
Scenarios
Vehicle Scenarios
Vehicle scenarios in the Transportation ATB incorporate assumptions about both the level of technology advancement achieved in each powertrain (e.g., lightweighting and engine efficiency) and the projected costs for the assumed technologies through 2050. Assumptions for assigning values in the Advanced and Mid trajectories reflect project teams' judgement. Given the rapid pace of technology improvement and market advancement, the assumptions here might not reflect the most recent trends. As data become available, ATB data are updated to reflect updated cost and performance trajectories.
In the ATB Advanced trajectory, technology advances occur with breakthroughs, increased public and private R&D investment, and other market conditions that lead to significantly improved cost and performance levels, but technologies do not necessarily reach their full technical potential. Vehicle technologies advance substantially and achieve high performance, low cost, or both. Attaining this level of cost improvement is assumed to be very uncertain.
In the ATB Mid trajectory, technology cost and performance improve at moderate levels with continued industry growth and R&D investment (both public and private). Vehicles include moderate technology advancements (in between the currently manufactured technology and the Advanced trajectory) to achieve higher performance, lower costs, or both. Attaining this level of cost improvement is assumed to be moderately uncertain.
In the ATB Constant trajectory, technology cost and performance from the base year are shown through 2050, without further advancement in R&D or markets. This cost level is extended through 2050 for reference only; it does not imply that frozen costs and performance are anticipated, and should not be confused with a business-as-usual or baseline scenario.
Technology advances include changes that may reduce costs or may increase costs while improving performance, which implies costs do not always decline between less-advanced and more-advanced scenarios. However, while technology advancements that improve performance may increase vehicle cost, they might also result in a lower levelized cost of driving due to potential fuel savings.
Fuel Scenarios
In the Current Market scenario, fuel price and emissions data are shown for fuels that are commercially available, and the exact source, timing, averaging, and other details described in the references. Fuel metrics are primarily based on data from the U.S. Energy Information Administration. Fuel price may differ from retail prices because of market volatility and local market conditions. See specific notes and references on the fuels pages for specific dates and averaging methods.
In this scenario, fuel metrics are based on techno-economic modeling of the current technology at current market production volume as specified in the notes and references on the fuels pages.
In this scenario, fuel metrics are based on techno-economic modeling of the current technology at high market production volume. Timing of this scenario depends on when high production volume is achieved.
In this scenario, fuel metrics are based on a future technological state modeled at low market production volume, as might be the case for a pioneer plant.
In this scenario, fuel metrics are based on a future technological state, based on engineering-economic modeling at high market production volume, often called "nth plant." Timing of this scenario depends on when high production volume is achieved.
Select subsets of fuels are shown on the vehicle charts for the Transportation ATB, and include the Baseline, Lowest Cost, and Lowest CO2e Emissions fuel pathways:
Baseline fuels are meant to best represent current fuels available for each powertrain today. Due to the variability of current market hydrogen prices, they are not used. Instead, current modeled, current volume costs are used as the baseline fuel for hydrogen for fuel cell electric vehicles.
The Lowest Cost fuels correspond to the fuel pathways with the lowest cost of those that are included in the ATB for each powertrain.
The Lowest CO2e Emissions fuels correspond to the fuel pathways with CO2e emissions of those that are included in the ATB for each powertrain.
The fuel pathways used for each powertrain for each fuel subset are shown in the table below. The charts on the Transportation ATB only include these select fuels, but the full set of fuels can be downloaded and explored.
Levelized Cost of Driving and Emissions
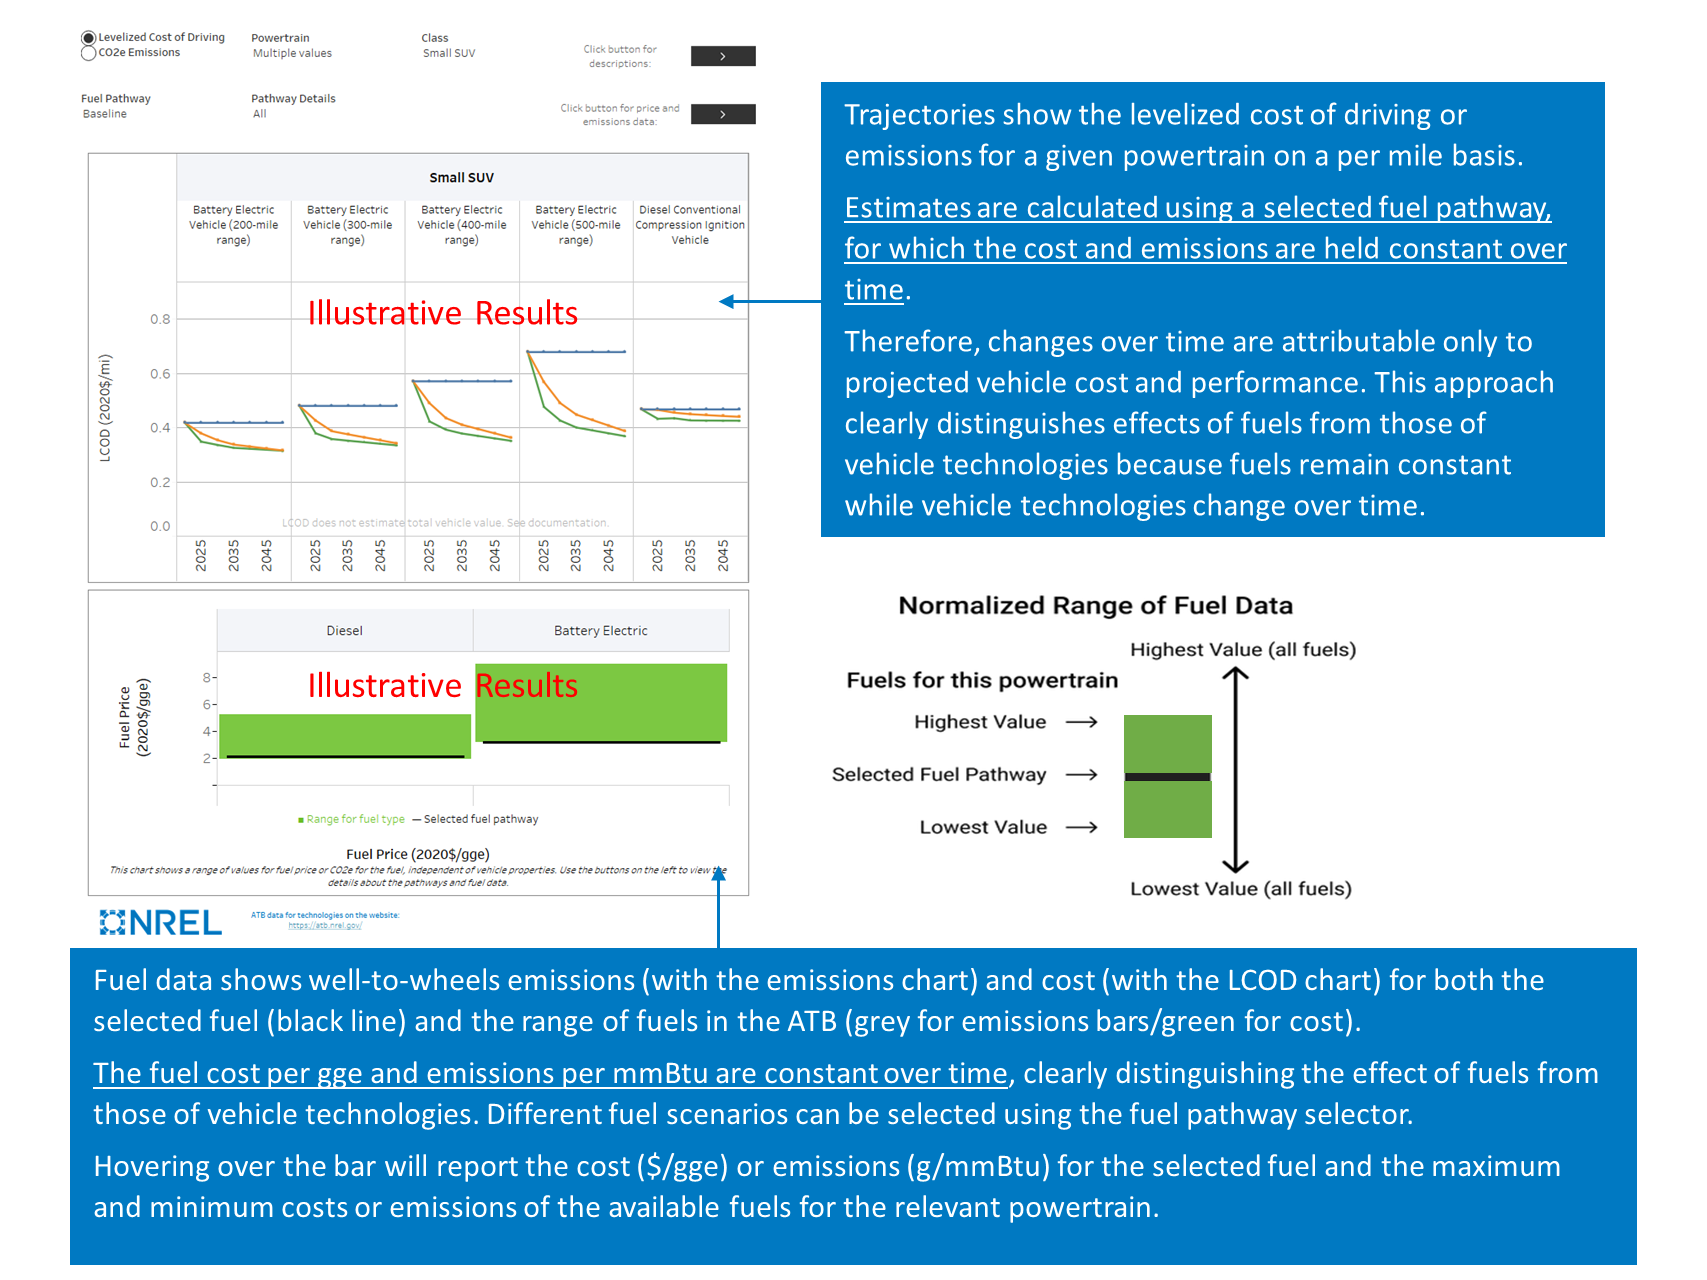
Calculations of the levelized cost of driving (LCOD) for included on-road vehicles and emissions combine information about the vehicle, such as fuel economy and emissions during vehicle use, with information about the fuel, such as upstream emissions. The charts that show emissions (g/mi) and LCOD ($/mi) trajectories are paired with fuel data for well-to-wheels emissions (grams per million Btu) and cost (dollars per million Btu) to show the fuel data that are used in the per-mile vehicle-level calculations. Single-point estimates of fuel costs and emissions rather than a full time-series trajectory are provided for each fuel pathway. The fuel data charts show how the selected fuel pathways compare to other fuel pathways within the Transportation ATB data set.
Comparisons of drivetrains should focus on the vehicle-level time-series trajectories, which include vehicle performance and convey its improvement over time. Comparisons of drivetrains should not focus on the fuel data, because drivetrains differ in their fuel efficiency. The LCOD and emissions charts clearly distinguish effects of fuels from those of vehicle technologies, because fuels remain constant but vehicle technologies change over time. The following chart, which provides an example of the charts shown in the Transportation ATB, shows how this information is combined.