Nuclear
2024 ATB data for advanced nuclear energy are shown above. These projections are based on a compilation of historical and recent cost estimates for various advanced nuclear energy technologies as well as historical U.S. costs for nuclear plant construction. The data include 35 bottom-up, detailed cost estimations for the reactors along with two data sets compiling historical observed U.S. costs for nuclear power plants. Values were mapped, escalated, and processed to ensure a suitable cross-comparison baseline between detailed estimates. Given the timeline for U.S. new reactor commercial demonstrations to start operations, the cost estimates provided start in 2030. This is primarily based on the timeline for U.S. Department of Energy (DOE) advanced reactor demonstration program reactors, which are expected to be complete near 2030. As such, the cost ranges are not for so-called "first-of-a-kind" (FOAK) but rather for "next commercial offerings" (or "between first- and Nth-of-a-kind [NOAK]"). The cost estimates are technology-agnostic, but distinctions between large (1,000 MWe) and small (300 MWe) reactors (often called small modular reactors, or SMRs) are made. Additional detail on the methodology for providing the estimates is provided in (Abou-Jaoude et al., 2024). The evolution in cost estimates over the duration considered is primarily driven by better project execution and experienced gained in deploying standardized reactor designs. Estimates for operating costs for large reactors are mainly derived from experience with the current fleet of nuclear power plants. Estimates for SMRs are based on a compilation of bottom-up historical data sets in a similar fashion to the capital expenses.
The writeup here leans heavily on (Abou-Jaoude et al., 2024). To help guide readers to the relevant sections of the report for additional information, the following outline is provided:
- Section 3: Overview of data sets leveraged from literature.
- Section 4: Mapping methodology and cost escalation.
- Section 5: Processing of capital cost estimates. This section also includes information on multi-unit plant impacts, recommended groupings, construction timelines, reactor lifetime, capacity factor, and ramp rates.
- Section 6: Operation and Maintenance Costs.
- Section 7: Nuclear deployment projections, learning rates, and cost reduction over time.
- Section 8: Impact of subsidies, coal-to-nuclear transition, and non-electric nuclear applications.
Future work will continue to refine the data sets provided here by incorporating additional bottom-up estimates of reactor designs being considered for deployment. As deployment of nuclear energy technologies move forward, actual costs will be incorporated to narrow the projected cost range. Estimates of operating costs and performance are based on currently operating reactors.
Scenario Descriptions
Because of the inherent uncertainty associated with projecting nuclear costs, all estimates were statistically evaluated to provide cost ranges. These were then used as starting points in the projected cost evolution of the technology. Despite potential opportunities for cost reductions, operating costs are assumed to remain constant at this stage (with starting points varying based on scenario). This is expected to be reasonable for the 60-year lifetime of a given plant; any efficiency gains achieved at later deployments can ultimately be applied to previously deployed reactors.
Quartiles from the processed extensive data set were then assigned to the different scenario definitions from the ATB. Because the data set includes a compilation of reactor estimates of various levels of assumed maturity, the quartiles can be interpreted as follows:
- Q1: This corresponds to data points closest to NOAK estimates. In other words, this quartile is closest to a well-executed next commercial offering. This can be assumed to correspond to an Advanced Scenario under ATB definition, in which significant investment is made to de-risk the technology before execution, ensuring cost overruns are avoided.
- Q2: This corresponds to data points between FOAK and NOAK estimates. In a sense, this is the baseline or Moderate Scenario that is most likely. Significant overruns and inefficiencies are expected to have occurred here but are not as pronounced as in Q3.
- Q3: This corresponds to data points closest to FOAK cost ranges. As such, very limited learning is assumed to have occurred between the first demonstration and this estimate. In a sense, this corresponds to the Conservative Scenario under ATB definition, in which many of the challenges faced with the FOAK have not been resolved when the next unit is built.
With these initial 2030 costs set, the cost evolution was obtained by applying learning rates to projected nuclear deployment scenarios found in the literature. In a similar fashion to the starting estimates, a broad base of references on nuclear reactor learning rates was compiled. This includes a mix of historical observed costs and detailed bottom-up projections of cost evolutions (especially for SMRs). Two averaged values for the learning rate were recommended: one for large reactors and another for SMRs. These parameters are taken to be inherent features of the technology and are not varied based on the different scenarios, however, the projected number of deployments was included. Capacity expansion models in the literature with varying costs of nuclear energy were analyzed to identify ideal matches to the current assumptions considered here. This will be described in further detail for each scenario.
A 25% market capture by a single technology was assumed, and spill-over learnings were considered. In other words, the modeling assumed at least 25% of the market is captured by a large reactor of a given design and another 25% by an SMR from a specific design. No assumption is made of the remaining 50% of the market, which contributes only to spill-over learning on the projected costs. Once suitable deployment curves are identified, the number of units deployed plus the learning rates can be used to develop cost evolution curves over time. Care was taken to ensure ultimate cost reduction projections from learning rates were still based on the realm of possibility (i.e., they did not exceed historical minima for normalized costs escalated to 2022 USD).
Scenario Assumptions
Conservative
The conservative nuclear deployment projections were based on an average of two references: (Kim, 2022) and (EIA, 2022). The first study, conducted by Pacific Northwest National Laboratory (PNNL), considered the buildout of nuclear and other clean energy sources under various scenarios. A capacity expansion model was used to project deployment rates under varying conditions. Though cases with imposed net-zero targets were leveraged for the Advanced Scenario, only the business-as-usual Reference cases were considered here. Under this scenario, nuclear technology is deployed depending only on its cost and grid needs at a given time. No underlying assumption is made about potential innovations or government investments in the technology. It is assumed government subsidies and incentives will expire in 2032, which limits private investment because of the high technology costs and high market penetration of nuclear power. As such, this scenario was deemed to align well with the conservative ATB definition.
The PNNL study considered various cost evolution trajectories for nuclear energy. A differential analysis was conducted against the recommendations from (Kim, 2022) to identify the best fit. It was determined scenario "Nuc56_Ref" most closely matched the large reactor and SMR cost evolution. However, because this scenario projected 3 gigawatts (GW) of nuclear deployment by 2030, deployment rates were further shifted later in time by 5 years to align with the assumption of the first "next commercial offering" starting in 2030 as well as to be more pessimistic about initial deployments coming online later than scheduled—which adds a layer of conservatism to this projected deployment scenario.
On the other hand, the Energy Information Agency (EIA) conducted a separate capacity expansion simulation with a baseline business-as-usual case in which no additional investment or government policy is made toward decarbonization (EIA, 2022). In its modeling, effectively no nuclear deployment is projected through 2050.
Rather than opining on the rigor of each analysis, this study opted for an averaged "middle ground" between the two cases. This is in line with the overarching methodology of (Abou-Jaoude et al., 2024) to query a large range of data sets rather than select a value from a single reference. As such, the modified PNNL case and the EIA Annual Energy Outlook 2022 Reference case were averaged to project nuclear buildouts by 2050. The GW deployment in 2035 was set to 1 GW based on the currently contracted builds that come to market behind their projected date of 2030: two advanced reactor demonstration projects in the United States (0.32 and 0.35 GW capacities, respectively) (OCED, 2023) and light water reactor deployment in Canada (0.3 GW) (GE Vernova, 2023). Nuclear deployment projections in both the United States and Canada were considered for the learning rate calculations. This is because some of the first technologies to be deployed in both countries are identical, which will result in learnings being directly applicable in the United States as well as linking supply chains across borders.
Table 1. Projected GW Deployed and Nuclear Cost Change in the Conservative Scenario (note projections encompass the United States and Canada)
| Year | Total Projected GW Nuclear Deployed | SMR % Cost Change Relative to 2030 Reference Value | Large Reactor % Cost Change Relative to 2030 Reference Value |
| 2025 | 0 | N/A | N/A |
| 2030 | 0 GW | Ref | Ref |
| 2035 | 1 GW | 4% | 0% |
| 2040 | 3 GW | 20% | 4% |
| 2045 | 6 GW | 30% | 12% |
| 2050 | 12 GW | 39% | 23% |
Moderate
The projections for nuclear deployments in the Moderate Scenario were primarily founded on current announcements for both contracted and potential deployments in public documents. A recent report aggregated recent announcements and identified 8.5 GW of nuclear deployments across the United States and Canada (Wood Mackenzie, 2024). Though not all of these announcements will necessarily lead to actual deployment, it is important to recognize many other energy users are currently considering nuclear deployments but have yet to make public announcements to that effect. As such, the 8.5 GW was deemed a realistic value for a moderate deployment scenario based on current information. Though many of these plants might be expected to come online in the 2035 time frame, a conservative assumption was made that this total capacity comes online by 2040. A deployment rate of 3 GW was then assumed for the 2035 timestep. This is equivalent to the recently observed deployments in the United States (~2 GW at Vogtle Units 3 and 4 (Southern Company, 2024) and ~1 GW at Watts Bar Unit 2 (TVA, 2016)).
Beyond 2040, a 5-year doubling of new installed nuclear plant capacity was assumed. This results in 17 GW deployed by 2045 and 34 GW of deployments by 2050. This is in line with the average of four 2040 deployment projections for nuclear in a broad capacity expansion model (Bistline et al., 2022). It is worth noting the resulting number of deployments was found to be lower than the most optimistic PNNL reference case ("Nuc26") (Kim, 2022).
For additional context, this corresponds to 1.7 GW/year deployment for 2040–2045 and 3.4 GW/year for 2045–2050. From a historical perspective, nuclear deployment in the United States averaged 4.5 GW/year with peaks greater than 10 GW/year in the 1970s (Kinsey et al., 2018). A yearly deployment maximum in 2045 below the average during that era was deemed realistic for a Moderate Scenario. Lastly, it is important to highlight these deployment projections within the context of the existing U.S. nuclear fleet. Assuming all existing plant licenses are extended to 80 years of operation, approximately 26 GW of capacity would go offline by 2050–2055 (NRC, 2024a). A 34-GW deployment by that time frame would constitute a net increase in nuclear power generation of only ~8%. As a result, the deployment projections for nuclear capacity are deemed suitable for a Moderate Scenario.
Using the same learning rate equation, the equivalent cost reductions were determined. The resulting cost reduction values are shown below along with the projected GW deployments in the United States and Canada.
Table 2. Projected GW Deployed and Nuclear Cost Change in the Moderate Scenario (note projections encompass the United States and Canada)
| Year | Total Projected GW Nuclear Deployed | SMR % Cost Change Relative to 2030 Reference Value | Large Reactor % Cost Change Relative to 2030 Reference Value |
| 2025 | 0 | N/A | N/A |
| 2030 | 1 GW | Ref | Ref |
| 2035 | 3 GW | 19% | 4% |
| 2040 | 8.5 GW | 34% | 18% |
| 2045 | 17 GW | 44% | 28% |
| 2050 | 34 GW | 50% | 37% |
Advanced
Next, the advanced scenarios were considered as part of this study. Again, two references were used here: the PNNL report mentioned previously (Kim, 2022) and a similar study conducted by the Breakthrough Institute (Stein et al., 2022). Both studies considered use cases with imposed net-zero targets by 2050 (NZ50) along with a range of nuclear reactor costs. These projections were deemed good fits for the ATB’s definition of an Advanced Scenario. The cases essentially assume government support and incentives in nuclear will continue and private investment will be encouraged to achieve technology improvements. The result is reduced long-term costs for new nuclear technologies with broader market penetration achieved.
Specifically, the PNNL NZ50 case "Nuc36" was deemed to line up well with both the large and small modular reactor cost evolutions considered here. The best matches for both large and small modular reactors in the Breakthrough study was deemed the "high-cost high-learning" scenario. Though the projects in each case were relatively close (~4% discrepancy in GW of nuclear energy deployed in 2050), an average of the PNNL and Breakthrough projections was used here. Finally, a ceiling of 200 GW was placed on the 2050 deployment value. This was done to align with the DOE Liftoff report, which considered multiple nuclear projection scenarios and concluded that 200 GW of nuclear deployment could be feasible by 2050 (DOE, 2023). The resulting assumed deployment numbers and corresponding percentage cost reduction are shown below.
Table 3. Projected GW Deployed and Nuclear Cost Change in the Advanced Scenario (note projections encompass the United States and Canada)
| Year | Total Projected GW Nuclear Deployed | SMR % Cost Change Relative to 2030 Reference Value | Large Reactor % Cost Change Relative to 2030 Reference Value |
| 2025 | 0 | N/A | N/A |
| 2030 | 1 GW | Ref | Ref |
| 2035 | 14 GW | 41% | 25% |
| 2040 | 58 GW | 55% | 43% |
| 2045 | 124 GW | 61% | 51% |
| 2050 | 200 GW | 64% | 55% |
Representative Technology
The data set of detailed cost estimates considered in this report consisted of a mix of reactor technologies. The reactor class can be deemed SMRs or large reactors as explained above whereas an even broader range of reactor types was included: pressurized water reactors (PWR), boiling water reactors (BWR), high-temperature gas reactors (HTGRs), sodium fast reactors (SFR), and molten-salt reactors (MSR). The processed value constitutes an amalgamation of the various reactor types. This is intentional because 1) all technologies are being actively pursued with near-term FOAK demonstrations announced, 2) it can be challenging to predict which technology will prevail and capture the 25% market share assumed here, and 3) uncertainty in cost estimates are too great to infer differences in costs between design types at this stage (Abou-Jaoude et al., 2023).
Typically for nuclear reactors, heat energy is extracted from the core (nuclear fuel) to run turbines for electricity production. Most of the sources assumed Rankine-based power conversions, but some specified Brayton-based cycle technology or heat-only applications. Depending on the reactor technology, turbines can be run directly by the primary coolant (coolant circulating between the fuel) or the secondary coolant (working fluid to which the heat energy from the primary coolant has been transferred via a heat exchanger). The heat energy generated from fission in nuclear reactors can be extracted using a variety of coolants (leading to different reactor designs), such as water, liquid metal, molten salts, or gases such as helium. The reactor technologies are generally named based on the primary coolant type. As such, light water reactors (LWRs) use regular water (as opposed to heavy water) and HTGRs, SFRs, and MSRs use gaseous helium, liquid sodium, and molten salt, respectively, as their primary coolants. Non-LWRs (such as HTGRs, SFRs, and MSRs) are under development whereas LWRs make up all the power-producing reactors in the United States (Nuclear Energy Institute, 2024) and are a mix of PWRs and BWRs.
PWRs, as the name suggests, consist of a pressurized primary system that maintains the coolant at a subcooled liquid state (preventing coolant boiling within the core). The primary coolant extracts heat energy from the core and subsequently passes through a steam generator to transfer the heat energy to the secondary coolant (water). Steam produced within the steam generator runs the turbine to produce electricity. Steam exiting from the turbine is directed through a condenser to create liquid water, which is then pumped back to the steam generator. Contrastingly, in BWRs, the turbine is run directly using the primary coolant. Regular water (primary coolant) moves through the core where fission heat is transferred from the core to the coolant, turning it into a mixture of steam and water. At the top of the core, the steam is directed to the turbine for power production. Unused steam is exhausted to a condenser to generate water, which is pumped back to the reactor core from the bottom. The main difference between PWRs and BWRs is the lack of a secondary coolant loop in BWRs and coolant boiling inside the reactor vessel core in BWRs.
In SFRs and MSRs, liquid sodium or molten salts are used as the primary coolant. For some MSR variants, the nuclear fuel is circulated as part of the salt, so depending on the reactor type and goals, there may be one or two stages of heat exchangers to transfer heat to the power generation side of the power plant. First, the fission heat energy is transferred to the primary coolant circulating in the core (which may or may not be solid fuel). The hot coolant travels through a heat exchanger, where heat energy is transferred to an intermediate working fluid (which may be the same working fluid as the primary coolant). In the final stage, the intermediate fluid is directed to another heat exchanger to heat the power‑cycle working fluid (which could be a gas or liquid) and produce electricity through the turbine.
HTGR systems use an inert gas, such as helium, as the primary coolant to extract heat energy from the fuel core. Although it is possible to have helium-driven turbines in HTGR systems, most HTGR designs include a steam generator to transfer heat from the primary helium to water that runs through a turbine.
In this study, the reactor design and coolant choice are assumed not to impact the nominal cost per kilowatt (kW) of energy. Nevertheless, notable changes in thermodynamic performance between each reactor type are important to highlight. The table below summarizes the recommended ranges to consider for thermal efficiency and reactor outlet temperature (ROT) based on reactor variants. This is important when considering heat-only application for nuclear energy. In essence, though the normalized cost per kilowatt-electric (kWe) is similar across reactor types, because of efficiency changes the cost per kilowatt-thermal (kWth) can be assumed to be variable across reactor types.
Table 4. Variations in Thermal Efficiency and Outlet Temperatures Based on Reactor Types
| Reactor Type | LWR | SFR | HTGR |
|---|---|---|---|
| Thermal efficiency | 33% | 37% | 40% |
| ROT | 325°C | 550°C | 750°C |
As previously explained, the cost estimates are grouped only between two types of technologies: large reactors (1,000 MWe) and SMRs (300 MWe). The table below provides the nominally assumed power output from each option, the assumed capacity factor, and the assumed construction time range for each. The construction duration is from the start of site construction to commercial operation (electricity going to the grid). These parameters impact cost-per-kWe projections for nuclear technology and should be accounted for when considering nuclear energy within grid planning activities.
Table 5. Relevant Technology Considerations for Cost Estimation
| Large Reactor | SMR | |
| Power output | 1,000 MWe | 300 MWe |
| Capacity factor | 93% | 93% |
| Construction time (advanced/moderate/conservative) | 60/82/125 months | 43/55/71 months |
Methodology
Nuclear energy in the United States has a breadth of historical construction data and a scarcity of recent construction experience (apart from the Vogtle and Watts Bar plants). As such, most attempts to quantify costs have relied heavily on historical experience with adjustments and considerations included to account for new technology advancements and evolving regulatory requirements. Because of the large, historical spread in normalized costs for the technology, new estimates will inevitably need to account for this high degree of uncertainty by providing a relatively large range that can be considered against the various ATB scenarios. Additional cost clarity will not become apparent until demonstrations or the next commercial offerings are built in the United States. Until then, the study leveraged here uses a mixture of historically observed costs and detailed cost estimates of modern designs to build a representative cost range for nuclear energy (Abou-Jaoude et al., 2024).
Capital Expenditures (CAPEX)
Capital expenditures are the dominant driver of levelized costs of nuclear reactors. As such, the methodology in (Abou-Jaoude et al., 2024) focuses primarily on providing guidance for these cost estimates. The methodology consisted of a six-step approach:
- Rather than selecting individual cost breakdowns, the study opted to compile a broad list of detailed data sets. Overall, 48 data sets across 18 distinct sources in the open literature were evaluated.
- To ensure an adequate baseline of comparison, all data sets were mapped into the standardized Generalized Nuclear Code of Account (GN-COA) format based on (Moneghan and Abou-Jaoude, 2024). This ensured post-processing was consistent and missing costs from sources could be identified.
- All estimates were escalated to the same reference 2022 USD value. This was done by weighing the equipment, labor, and material costs in each case and using distinct indices to adjust these prices.
- To cross-compare across the reactor sizes, all cost values were then normalized in terms of $/kWe. Here, values were normalized in reference to the total plant output rather than individual reactors in multiunit cases.
- Missing data in some instances were populated after the fact to ensure consistency and completeness. Different approaches were selected depending on the cost account. In most cases, the data set average $/kWe value was used (e.g., for preconstruction costs). In others, independent detailed estimates were generated (e.g., for decommissioning or initial fuel core load).
- The resulting data were then aggregated and processed into quartiles to produce the initial 2030 cost ranges for a "next commercial offering."
Considering the selected methodology, it is important to explain how to interpret the recommended values. Because future U.S. nuclear reactor costs are still unknown due to little recent observed data, the report (Abou-Jaoude et al., 2024) opted to compile a comprehensive list of bottom-up estimates and evaluate averages and trends within the data to identify reference ranges. The main driver of the study was to provide transparent detailed costs and evaluate statistical quartiles in a relatively large data set to minimize the inference of biases of individual estimators. The values are essentially generalized and should not be interpreted as project- or site-specific estimates. As previously explained, the costs are also not considered applicable for a FOAK demonstration. The first plants (advanced reactor demonstration program) are expected to come online with substantial governmental support. Rather, the intent is to forecast the range of values for subsequent units deployed. Additional considerations related to multiple unit sites are provided in later sections.
Limitations of the employed methodology are also summarized in (Abou-Jaoude et al., 2024). As is the case with any meta-study, the fidelity of the ranges produced depends on the quantity and quality of data used. In this case, 48 estimates were collected, but after excluding select values as outliers, only 35 could be used to produce the quartile ranges. Incorporating more data would improve fidelity, but in the case of bottom-up estimates, the number of available open-source data sets is still relatively small. This limitation on the availability of data also makes it difficult to produce multiple subgroupings based on technologies and designs. Another limitation of this approach is the lack of information from most data sets on the type of estimate generated (Class 5 versus Class 4, and so on) and what kind of error band is associated with the reported numbers. It is common for estimates to have varying ranges of error and, ideally, this would be accounted for—and only similar class estimates would be compared. For example, a Class 5 estimate can have an expected cost variance up to 100% whereas a Class 2 estimate would expect to be only up to 20% high (AACE International, 2005). Because a significant portion of the data is historic, the resulting costs processed here inherently depend on the escalation methodology. Though the approach used in the report is considered defensible, ideally, each cost account would be subdivided into specific cost components (e.g., type of labor activity, specific material used). However, this level of detail was seldom available. In addition, several cost categories are considered for nuclear energy that may not be accounted for in other technologies. Nuclear energy is required to plan for decommissioning and, as such, costs related to decommissioning are included. Given the uncertainty around costs and technology, the estimates include contingency costs—those are carried over into the ATB values. Lastly, indirect/owner costs are included as part of these values, but there is recognition that certain owners or projects may need to be modified based on the group using these values.
The resulting cost breakdown for nuclear energy cost items is shown in the table below. This contains all the costs accounted for in the ATB values. As explained previously, the structure is based on the GN-COA developed by EPRI and a DOE national laboratory (Moneghan and Abou-Jaoude, 2024). The detailed breakdown highlights the level of fidelity pursued as part of this study and ensured completeness of the analysis conducted.
Table 6. Breakdown of the Cost Contributions to the Two Reactor Technology Groupings Considered (note many of the costs appear as 0% because of rounding)
| Account Name | Large Reactor | SMR |
|---|---|---|
| 10: Capitalized Preconstruction Costs | 7.02% | 5.09% |
| 11: Land and Land Rights | 0.06% | 0.20% |
| 12: Site Permits | 0.36% | 0.12% |
| 13: Plant Licensing | 3.46% | 2.45% |
| 14: Plant Permits | 0.37% | 0.29% |
| 15: Plant Studies | 0.53% | 0.40% |
| 16: Plant Reports | 0.26% | 0.21% |
| 17: Community Outreach and Education | 0.00% | 0.00% |
| 18: Other Preconstruction Costs | 1.17% | 0.81% |
| 19: Contingency on Preconstruction Costs | 0.80% | 0.62% |
| 20: Capitalized Direct Costs | 65.42% | 64.61% |
| 21: Structures and Improvements | 16.13% | 19.99% |
| 22: Reactor System | 13.21% | 14.47% |
| 23: Energy Conversion System | 3.92% | 3.86% |
| 24: Electrical Equipment | 6.32% | 9.46% |
| 25: Initial Fuel Inventory | 2.25% | 3.00% |
| 26: Miscellaneous Equipment | 2.25% | 3.00% |
| 27: Material Requiring Special Consideration | 6.18% | 0.00% |
| 28: Simulator | 0.00% | 0.00% |
| 29: Contingency on Direct Costs | 15.15% | 10.83% |
| 30: Capitalized Indirect Services Cost | 21.44% | 26.01% |
| 31: Factory and Field Indirect Costs | 7.36% | 7.91% |
| 32: Factory and Construction Supervision | 5.26% | 3.02% |
| 33: Startup Costs | 0.43% | 0.78% |
| 34: Shipping and Transportation Costs | 0.00% | 0.74% |
| 35: Engineering Services | 7.47% | 4.01% |
| 36: Project/Construction Management Services | 0.93% | 2.95% |
| 39: Contingency on Indirect Services Cost | 0.00% | 6.59% |
| 50: Capitalized Supplementary Costs | 5.92% | 4.29% |
| 51: Taxes | 0.00% | 0.06% |
| 52: Insurance | 1.56% | 0.70% |
| 53: Spent Fuel Storage | 0.00% | 0.00% |
| 54: Decommissioning | 0.17% | 0.22% |
| 55: Other Owners' Costs | 0.00% | 0.00% |
| 56: Fees | 0.00% | 0.00% |
| 57: Management Reserve | 0.00% | 0.00% |
| 59: Supplementary Contingencies | 4.20% | 3.31% |
The costs of nuclear reactors (especially in terms of financing) depend strongly on construction time. The values selected for large reactors were based on observed historical experiences where the International Atomic Energy Agency (IAEA) compiles a comprehensive database of milestones in nuclear construction (e.g., start, fuel loading, startup). The quartile range for large reactors was taken to be 125/82/60 months for the Conservative, Moderate, and Advanced Case, respectively.
Because SMRs have yet to be built, construction durations were inferred from a mix of data from utility integrated resource plans (IRPs) (Duke Energy, 2023)(CNSC, 2024) and detailed probabilistic bottom-up scheduling models for modularized reactors from the literature (Robb Stewart and Shirvan, 2023). The resulting statistical quartile range for SMRs was taken to be 71/55/43 months for the Conservative, Moderate, and Advanced Case, respectively.
Lastly, cost projections beyond 2030 hinged primarily on assumed learning rates for nuclear reactors. A broad base of references on nuclear reactor learning rates was compiled, including a mix of historical observed costs and detailed bottom-up projections of cost evolutions (especially for SMRs). Two averaged values for the learning rate were determined, and a value of 8% was used for large reactors and 9.5% for SMRs (Abou-Jaoude et al., 2024).
For the technical lifetime of a nuclear energy generating station, the U.S. Nuclear Regulatory Commission (NRC) can issue licenses for up to 40 years. Follow-on license renewals can be obtained in additional 20-year increments. Many LWRs already have licenses that will keep them operating for 60-year lifetimes; others are applying for operation for 80 years with potential for operation beyond that in the future. For the power sources here, the technical life is considered 60 years, but there is potential for longer operations in the future (NRC, 2024b).
Operation and Maintenance (O&M) Costs
Following a similar methodology to the capital costs, operating expenses are derived via a compilation of existing observed data and a broad range of detailed cost projections. The operating and maintenance costs are built on a range of observed costs and do not account for potential technological changes that could lead to future decreases even for the Advanced Scenario. For instance, certain reactors may consider longer fuel cycles or autonomous operations that could impact future costs. These types of considerations will be addressed in future iterations of the ATB. Cost reductions for multi-unit sites are discussed in the Multiple Unit site considerations section below. Additional information on the methodology can be found in (Abou-Jaoude et al., 2024). The table below provides an overview of the various subcomponents that were considered as part of the analysis.
Table 7. Inclusions in O&M
| Category | Item |
| Variable nonfuel O&M | Power-dependent consumables |
| Fixed O&M | Operational staff Fixed maintenance expenses Indirect support and management staff Inspections Annualized decommissioning payments Property taxes |
| Fuel | Mining Conversion Enrichment Deconversion Fabrication Depleted uranium disposal Spent fuel packaging and disposal |
Nonfuel operational costs for large reactors were based on the observed experience with the current nuclear fleet (NEI, 2023). Annualized decommissioning expenses were adjusted (to reflect the fact that a newly built reactor will have larger payment than existing builds with over 40 years of accumulated reserves); property taxes were also included in the estimate. The variable nonfuel portion was taken to be 13% of total nonfuel costs based on (EIA, 2020). In the case of SMRs, the nonfuel O&M costs were based on aggregates from the large data set compiled of projected, detailed cost estimates for this class of nuclear reactors.
Fuel costs were derived explicitly in this study using a bottom-up calculation of the mining, enrichment, conversion, and disposal needs. The values obtained were based on the methodology and estimates in (Dixon et al., 2017). It is important to note that although fuel costs are typically treated as variable expenses, in the case of nuclear energy, this is much more complicated. The current fleet operates with minimum power flexing, and fuel expenses are essentially fixed. Shifting to a reliable 18-month refueling schedule has meant that reactors are often refueled even if burnup targets are not met (rather than delaying the schedule of preplanned maintenance activities). In the future, however, nuclear power plants are expected to flex much more frequently, and higher burnup with longer power cycles is likely. Under these conditions, it is becoming increasingly likely that fuel costs will be treated in a much more variable fashion with refueling delayed if power has been derated substantially during the cycle of operation.
Capacity Factor and Ramp Rate
The current LWR fleet of reactors in the United States operates at a very high capacity factor—an average of 92.7% (EIA, 2020). The American Nuclear Society (ANS) also tracks U.S. capacity factors and noted between 2020 and 2022, they show a median capacity factor of 91.13% (Gallier, 2023). The ARIS database tracks all nuclear reactors throughout the world, with a large fraction of reactors over the 90% level (IAEA, 2024).
Note most of these data are centered on current LWRs in operation. These reactors operate on standard 18- or 24-month fuel cycles. The advanced reactors that will be deployed include both LWR technology as well as non-LWR technologies. For LWR technologies, it is reasonable to assume they will continue to operate at or near the same capacity factors as current LWR technologies. It is possible that non-LWR technologies will not operate at high capacity factors early in their deployments. However, within their 60-year lifetime, they are expected to eventually reach these levels. Furthermore, it should be noted many advanced reactors (non-LWRs) under consideration are exploring longer fuel cycles where many of these plants could operate longer without refueling, or even operate with continuous refueling. These advancements may push capacity factors higher, to the range of 95%. Many nuclear utilities may also first deploy LWR technology given the similarity to currently operating reactors, which means non-LWR technologies could be deployed later (maybe late 2030s). Given the variety of designs and the potential deployment timelines, the current U.S. average of 0.93 is selected as a reasonable capacity factor for use in modeling efforts. It should be noted that these capacity factors assume current operations in the United States which is baseload operation with limited ramping. If a plant is assumed to ramp daily or frequently, a lower capacity factor would be achieved.
The current nuclear reactors in the United States are large nuclear reactors that mainly operate as baseload units in the current environment, with limited daily power ramping; however, there are not necessarily any inherent technological limitations with ramping existing reactor power within its established technical ranges (similar to the large reactor information here). Many of the advanced reactors are designed to more effectively ramp their power to support a grid with increased variable power generation and thus have faster ramp rates than current LWRs. It should be noted nuclear reactors are capable of other power changes to deal with frequency or emergency operations. One area being considered by at least one reactor developer is to combine the reactor with a thermal energy storage system, which would allow even greater flexibility.
The various reactor technologies will all have different ramping characteristics based on the specific technology and how the reactor is configured. Reactors can be setup to operate in a baseload configuration or they can be setup in a load follow mode. For setting up in a load follow mode, higher ramp rates will most likely be achieved through turbine bypass and dumping steam to the condenser for light water reactors. Other technologies will vary in how they handle ramping and it will be dependent on the specific reactor technology, size of the unit and whether it is combined with thermal energy storage capability. The other factor is that some SMRs are looking at utilizing multiple modules which would mean that one or more units within the same SMR could ramp power. (Abou-Jaoude et al., 2024) compiled various ramp rates as reported by various technologies. The following table provides the ramp rates selected for energy modeling, which are near the upper ends of the ranges and are applicable both to increasing and decreasing the electric power for the unit.
Table 8. Reference Ramp-Rate Values Used for Large and Small Modular Reactors
| Reactor Type | Ramp Rate (%Power/min) |
|---|---|
| Large Reactors | 5% |
| SMRs | 10% |
For reactors that may be paired with thermal energy storage systems, the combination allows for faster ramping of the power output because the reactor does not need to ramp or change power levels to support the change in power generation, supporting a high capacity factor and better operating economics. The molten-salt storage system ramps to help adapt to changing power demand and can ramp at 12% Power/min, which is larger than the SMR rate of 10% Power/min (Abou-Jaoude et al., 2024).
Additional Considerations
This writeup only contains a summary of (Abou-Jaoude et al., 2024) that is electricity specific for the ATB. Additional information for manipulating the reference nuclear energy cost values are provided in (Abou-Jaoude et al., 2024), including the following:
- Multiple unit considerations, which are described in further detail below.
- Coal-to-nuclear (C2N) transitions, which are described in further detail below.
- The impact of subsidies on nuclear energy costs such as the recent Inflation Reduction Act (IRA) investment or production credits, which are applicable to nuclear energy. Additional information can be found in the report.
- Heat-only applications (to support process steam applications such as chemical production) and resulting cost ranges for nuclear reactors. This is a rising area of interest for nuclear technology because more sectors of the economy are looking at ways to reduce carbon emissions. Additional information can be found in the report.
Multiple Unit Site Considerations
Hosting several reactor plants at the same site is a well-known approach for reducing the costs of nuclear builds. Most existing sites in the US have more than one nuclear plant. Cohosting several plants in the same location enables synergies both on the capital and the operational side. For instance, the same warehousing buildings can be used for more than one plant, and maintenance crew can be rotated from one unit to the next as needed. Based on the review of existing data in (Abou-Jaoude et al., 2024), the following cost adjustments are recommended for multi-unit sites. This is in addition to the expected cost reductions from learning.
Table 9. Cost adjustment for multi-unit plant sites. Adjustment are for the site-wide averages (interpolate as needed between the values).
| Number of units | OCC Cost Reduction | O&M Cost Reduction |
|---|---|---|
| 1 | 1.0 | 1.0 |
| 2 | 0.9 | 0.67 |
| 4 | 0.8 | 0.67 |
| 8 | 0.7 | 0.67 |
| 10 | 0.7 | 0.67 |
It is also important to note that the concept of a ‘unit’ may, in fact, be nuanced in several designs. For instance, some vendors only offer reactors in four- or six-packs. Therefore, in the case of a four-pack concept, multi-unit cost reductions could differ within the pack and between the first four-pack and the second. For simplicity in the analysis, it is recommended to apply the cost reductions below by treating each multi-unit pack as a single unit.
Coal-to-Nuclear Transition
There is increasing discussion on best approaches to transition the United States to clean power sources while providing benefits to communities with economies that rely heavily on fossil-fuel-based energy production. Coal plants create jobs and produce tax revenue for their communities that are challenging to replace with alternative sources of energy plants. A DOE report found a significant number (~80%) of coal sites (operating and recently retired) could be amendable to siting an advanced nuclear reactor (Hansen et al., 2022). It was determined that using an existing site can reduce specific costs, depending on the extent to which existing infrastructure can be repurposed. This could be in the form of using building infrastructure as well as the existing electrical infrastructure (e.g., switchyard). More aggressive forms of asset repurposing would include using portions of the secondary (steam) side of the plant. This depends on many factors that would need to be considered on a project-specific basis (e.g., refurbishment or modification needs). The table below provides various cost-reduction ranges to nuclear power plant overnight capital cost (OCC) established to replace a preexisting coal plant. The values are based on the recommendations from (Hansen et al., 2022).
Table 9. Potential CAPEX Cost Savings from Coal-to-Nuclear Conversion
| Advanced | Moderate | Conservative | |
| Large reactor OCC cost reduction from C2N | -25% | -20% | -15% |
| SMR OCC cost reduction from C2N | -34% | -26% | -17% |
In addition to the cost savings from leveraging existing land rights and infrastructure, using a coal site to build a nuclear power plant can bring additional benefits in the form of subsidies. The Energy Community Tax Credit Bonus within IRA offers an additional benefit of either up to 10% production credits or an increase of 10 percentage points for investment credits. This bonus is specifically applicable to projects, facilities, and technologies situated within designated energy communities. Eligible taxpayers who meet specific energy-community criteria outlined in Sections 45, 48, 45Y, or 48E of the Internal Revenue Code may access enhanced credit amounts or rates (IRS, 2023). The IRA outlines the criteria for energy communities, defining them as follows:
- A brownfield site, identified in designated sections of the Comprehensive Environmental Response, Compensation, and Liability Act of 1980 (CERCLA).
- An area that has demonstrated, at any point since 2009, a direct employment level of 0.17% or higher, or local tax revenues constituting 25% or more of the total, related to the extraction, processing, transport, or storage of coal, oil, or natural gas. In addition, the area must have an unemployment rate equal to or exceeding the national average for the preceding year.
- A census tract, or one directly adjacent, where a coal mine has halted operations after 1999 or a coal‑fired electric generating unit has been retired post-2009.
The following map shows a census tract directly adjoining a census tract with a coal closure (light orange), a census tract with a coal closure (dark orange), and in dark purple the areas metropolitan statistical areas (MSAs)/non-MSAs that meet both the Fossil Fuel Employment (FFE) threshold and the unemployment rate requirement (IRS, 2023).
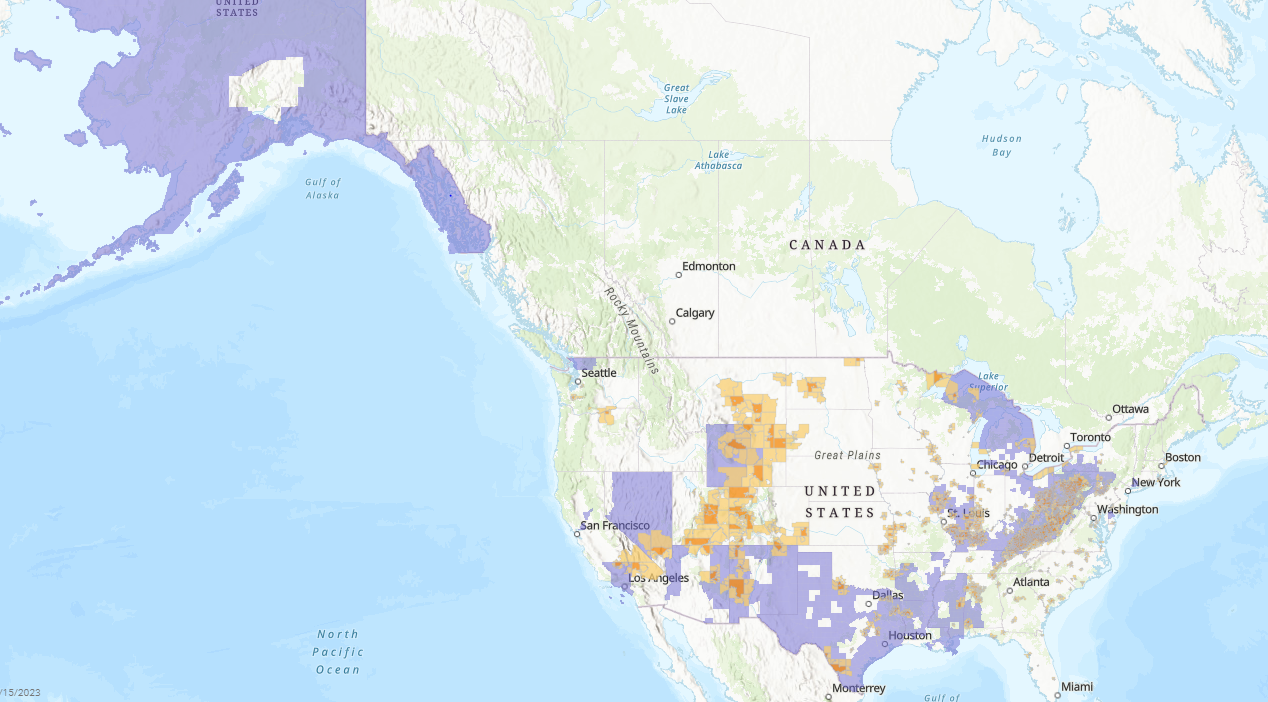
Figure 1. Areas that meet the requirements to receive the Energy Community Tax Credit Bonus
Based on these criteria, it can be reasonable to expect substantial overlap between qualifying coal communities and potential for nuclear power plant new builds. Additional information on the potential impact from C2N transitions can be found in (Hansen et al., 2022) and (Abou-Jaoude et al., 2024).
References
The following references are specific to this page; for all references in this ATB, see References.